Guyanese vs Immigrants from Congo 9th Grade
COMPARE
Guyanese
Immigrants from Congo
9th Grade
9th Grade Comparison
Guyanese
Immigrants from Congo
92.7%
9TH GRADE
0.0/ 100
METRIC RATING
303rd/ 347
METRIC RANK
93.9%
9TH GRADE
0.4/ 100
METRIC RATING
264th/ 347
METRIC RANK
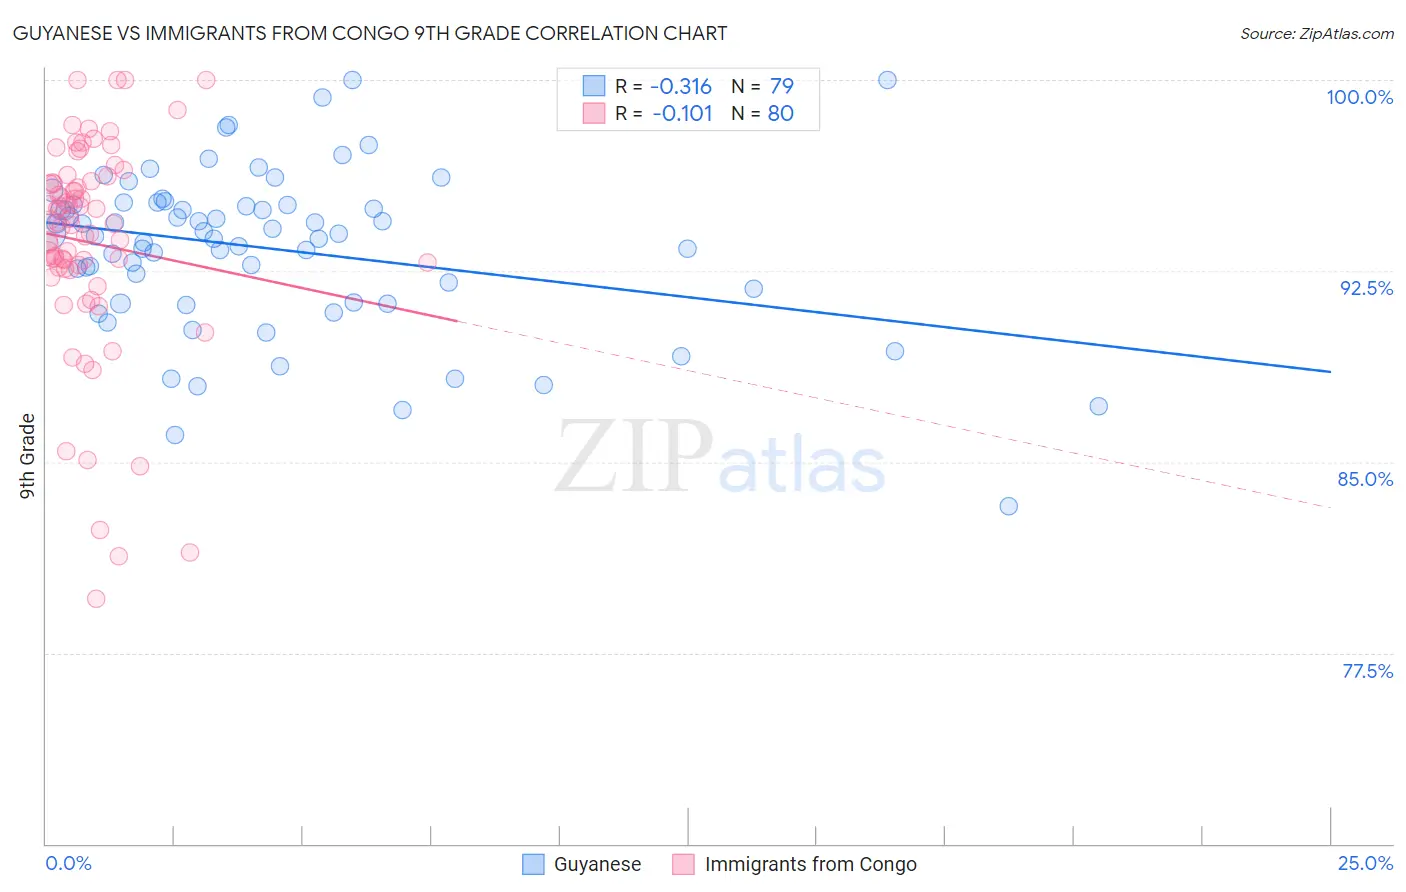
Guyanese vs Immigrants from Congo 9th Grade Correlation Chart
The statistical analysis conducted on geographies consisting of 176,937,226 people shows a mild negative correlation between the proportion of Guyanese and percentage of population with at least 9th grade education in the United States with a correlation coefficient (R) of -0.316 and weighted average of 92.7%. Similarly, the statistical analysis conducted on geographies consisting of 92,132,988 people shows a poor negative correlation between the proportion of Immigrants from Congo and percentage of population with at least 9th grade education in the United States with a correlation coefficient (R) of -0.101 and weighted average of 93.9%, a difference of 1.3%.
9th Grade Correlation Summary
| Measurement | Guyanese | Immigrants from Congo |
| Minimum | 83.3% | 79.6% |
| Maximum | 100.0% | 100.0% |
| Range | 16.7% | 20.4% |
| Mean | 93.4% | 93.6% |
| Median | 93.9% | 94.4% |
| Interquartile 25% (IQ1) | 91.2% | 92.6% |
| Interquartile 75% (IQ3) | 95.1% | 96.0% |
| Interquartile Range (IQR) | 3.9% | 3.4% |
| Standard Deviation (Sample) | 3.2% | 4.2% |
| Standard Deviation (Population) | 3.2% | 4.2% |
Similar Demographics by 9th Grade
Demographics Similar to Guyanese by 9th Grade
In terms of 9th grade, the demographic groups most similar to Guyanese are Immigrants from Dominica (92.7%, a difference of 0.020%), Tohono O'odham (92.6%, a difference of 0.020%), Japanese (92.6%, a difference of 0.040%), Immigrants from Vietnam (92.6%, a difference of 0.040%), and Immigrants from Haiti (92.7%, a difference of 0.10%).
| Demographics | Rating | Rank | 9th Grade |
| Indonesians | 0.0 /100 | #296 | Tragic 93.1% |
| Fijians | 0.0 /100 | #297 | Tragic 93.1% |
| Haitians | 0.0 /100 | #298 | Tragic 93.1% |
| Immigrants | Grenada | 0.0 /100 | #299 | Tragic 93.0% |
| Yaqui | 0.0 /100 | #300 | Tragic 92.9% |
| Immigrants | Haiti | 0.0 /100 | #301 | Tragic 92.7% |
| Immigrants | Dominica | 0.0 /100 | #302 | Tragic 92.7% |
| Guyanese | 0.0 /100 | #303 | Tragic 92.7% |
| Tohono O'odham | 0.0 /100 | #304 | Tragic 92.6% |
| Japanese | 0.0 /100 | #305 | Tragic 92.6% |
| Immigrants | Vietnam | 0.0 /100 | #306 | Tragic 92.6% |
| Immigrants | Immigrants | 0.0 /100 | #307 | Tragic 92.5% |
| Immigrants | Guyana | 0.0 /100 | #308 | Tragic 92.5% |
| Immigrants | Bangladesh | 0.0 /100 | #309 | Tragic 92.4% |
| Immigrants | Cambodia | 0.0 /100 | #310 | Tragic 92.4% |
Demographics Similar to Immigrants from Congo by 9th Grade
In terms of 9th grade, the demographic groups most similar to Immigrants from Congo are Immigrants from Uzbekistan (93.9%, a difference of 0.0%), Native/Alaskan (93.9%, a difference of 0.0%), Immigrants from Jamaica (93.9%, a difference of 0.010%), Navajo (93.9%, a difference of 0.010%), and South American (93.9%, a difference of 0.030%).
| Demographics | Rating | Rank | 9th Grade |
| Immigrants | Costa Rica | 0.5 /100 | #257 | Tragic 94.0% |
| Immigrants | Thailand | 0.5 /100 | #258 | Tragic 93.9% |
| Ghanaians | 0.5 /100 | #259 | Tragic 93.9% |
| Pima | 0.4 /100 | #260 | Tragic 93.9% |
| South Americans | 0.4 /100 | #261 | Tragic 93.9% |
| Immigrants | Jamaica | 0.4 /100 | #262 | Tragic 93.9% |
| Immigrants | Uzbekistan | 0.4 /100 | #263 | Tragic 93.9% |
| Immigrants | Congo | 0.4 /100 | #264 | Tragic 93.9% |
| Natives/Alaskans | 0.4 /100 | #265 | Tragic 93.9% |
| Navajo | 0.3 /100 | #266 | Tragic 93.9% |
| Armenians | 0.3 /100 | #267 | Tragic 93.9% |
| Immigrants | Bolivia | 0.3 /100 | #268 | Tragic 93.9% |
| Immigrants | Uruguay | 0.2 /100 | #269 | Tragic 93.8% |
| Yuman | 0.2 /100 | #270 | Tragic 93.8% |
| Immigrants | Ghana | 0.2 /100 | #271 | Tragic 93.8% |