Immigrants from Germany vs Immigrants from Trinidad and Tobago 9th Grade
COMPARE
Immigrants from Germany
Immigrants from Trinidad and Tobago
9th Grade
9th Grade Comparison
Immigrants from Germany
Immigrants from Trinidad and Tobago
95.6%
9TH GRADE
98.7/ 100
METRIC RATING
93rd/ 347
METRIC RANK
93.6%
9TH GRADE
0.1/ 100
METRIC RATING
281st/ 347
METRIC RANK
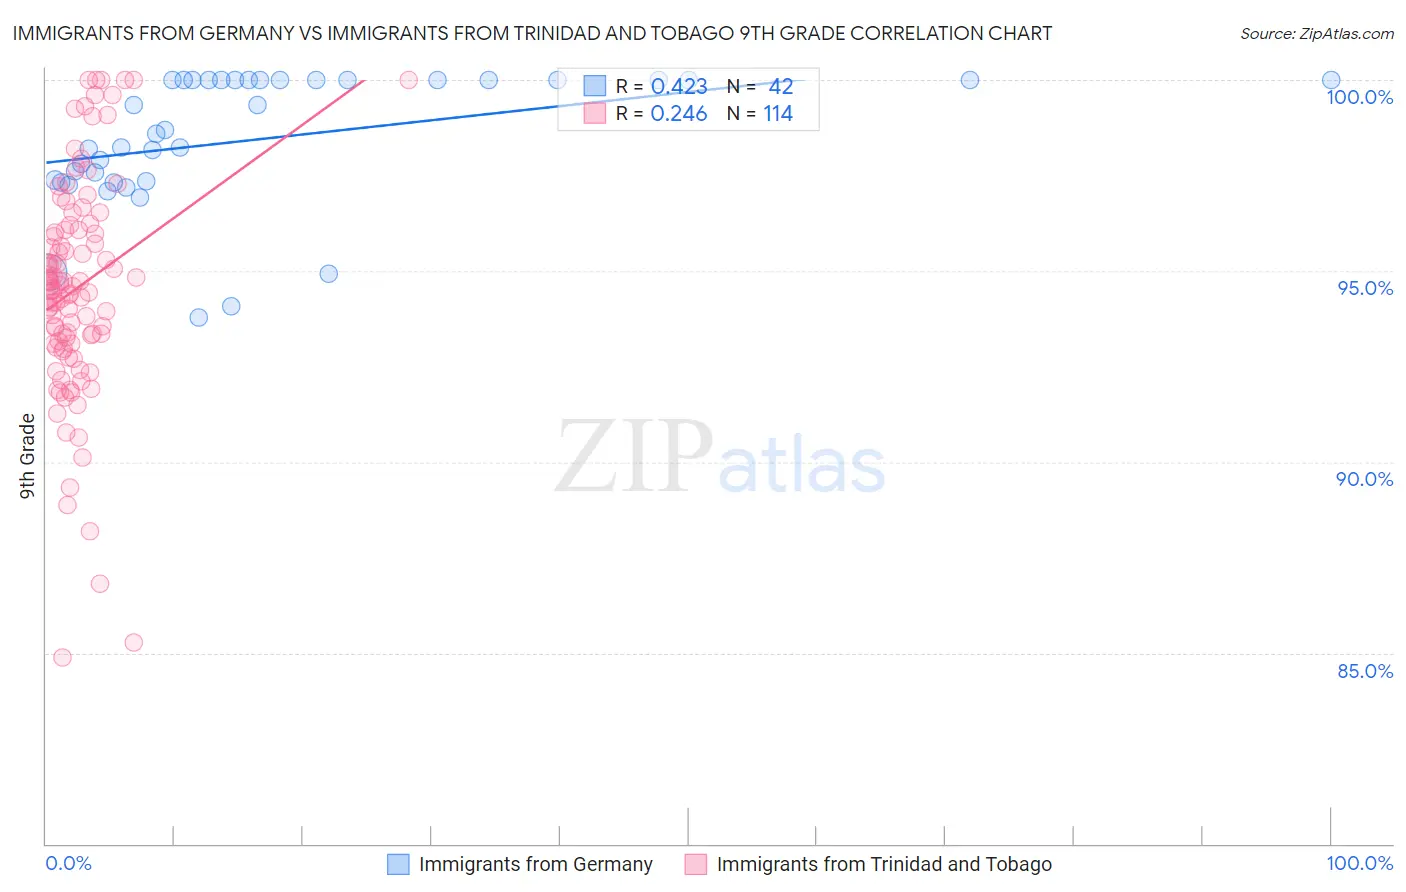
Immigrants from Germany vs Immigrants from Trinidad and Tobago 9th Grade Correlation Chart
The statistical analysis conducted on geographies consisting of 463,886,920 people shows a moderate positive correlation between the proportion of Immigrants from Germany and percentage of population with at least 9th grade education in the United States with a correlation coefficient (R) of 0.423 and weighted average of 95.6%. Similarly, the statistical analysis conducted on geographies consisting of 223,526,834 people shows a weak positive correlation between the proportion of Immigrants from Trinidad and Tobago and percentage of population with at least 9th grade education in the United States with a correlation coefficient (R) of 0.246 and weighted average of 93.6%, a difference of 2.2%.
9th Grade Correlation Summary
| Measurement | Immigrants from Germany | Immigrants from Trinidad and Tobago |
| Minimum | 93.8% | 84.9% |
| Maximum | 100.0% | 100.0% |
| Range | 6.2% | 15.1% |
| Mean | 98.5% | 94.5% |
| Median | 98.6% | 94.6% |
| Interquartile 25% (IQ1) | 97.3% | 93.1% |
| Interquartile 75% (IQ3) | 100.0% | 96.1% |
| Interquartile Range (IQR) | 2.7% | 3.0% |
| Standard Deviation (Sample) | 1.7% | 2.9% |
| Standard Deviation (Population) | 1.7% | 2.9% |
Similar Demographics by 9th Grade
Demographics Similar to Immigrants from Germany by 9th Grade
In terms of 9th grade, the demographic groups most similar to Immigrants from Germany are Immigrants from Latvia (95.6%, a difference of 0.0%), Creek (95.6%, a difference of 0.010%), Immigrants from Saudi Arabia (95.6%, a difference of 0.010%), Yugoslavian (95.7%, a difference of 0.020%), and South African (95.6%, a difference of 0.020%).
| Demographics | Rating | Rank | 9th Grade |
| Immigrants | Western Europe | 99.1 /100 | #86 | Exceptional 95.7% |
| Okinawans | 99.0 /100 | #87 | Exceptional 95.7% |
| Immigrants | Czechoslovakia | 98.9 /100 | #88 | Exceptional 95.7% |
| Yugoslavians | 98.9 /100 | #89 | Exceptional 95.7% |
| South Africans | 98.8 /100 | #90 | Exceptional 95.6% |
| Creek | 98.8 /100 | #91 | Exceptional 95.6% |
| Immigrants | Saudi Arabia | 98.8 /100 | #92 | Exceptional 95.6% |
| Immigrants | Germany | 98.7 /100 | #93 | Exceptional 95.6% |
| Immigrants | Latvia | 98.7 /100 | #94 | Exceptional 95.6% |
| Americans | 98.5 /100 | #95 | Exceptional 95.6% |
| Filipinos | 98.5 /100 | #96 | Exceptional 95.6% |
| Delaware | 98.4 /100 | #97 | Exceptional 95.6% |
| Immigrants | Japan | 98.4 /100 | #98 | Exceptional 95.6% |
| Menominee | 98.3 /100 | #99 | Exceptional 95.6% |
| Lebanese | 98.1 /100 | #100 | Exceptional 95.6% |
Demographics Similar to Immigrants from Trinidad and Tobago by 9th Grade
In terms of 9th grade, the demographic groups most similar to Immigrants from Trinidad and Tobago are Taiwanese (93.6%, a difference of 0.040%), Malaysian (93.5%, a difference of 0.050%), Barbadian (93.5%, a difference of 0.070%), Trinidadian and Tobagonian (93.7%, a difference of 0.12%), and Bangladeshi (93.4%, a difference of 0.14%).
| Demographics | Rating | Rank | 9th Grade |
| Peruvians | 0.2 /100 | #274 | Tragic 93.8% |
| Immigrants | Colombia | 0.2 /100 | #275 | Tragic 93.8% |
| West Indians | 0.2 /100 | #276 | Tragic 93.7% |
| Immigrants | Philippines | 0.1 /100 | #277 | Tragic 93.7% |
| Immigrants | Eritrea | 0.1 /100 | #278 | Tragic 93.7% |
| Trinidadians and Tobagonians | 0.1 /100 | #279 | Tragic 93.7% |
| Taiwanese | 0.1 /100 | #280 | Tragic 93.6% |
| Immigrants | Trinidad and Tobago | 0.1 /100 | #281 | Tragic 93.6% |
| Malaysians | 0.0 /100 | #282 | Tragic 93.5% |
| Barbadians | 0.0 /100 | #283 | Tragic 93.5% |
| Bangladeshis | 0.0 /100 | #284 | Tragic 93.4% |
| Immigrants | Peru | 0.0 /100 | #285 | Tragic 93.4% |
| Immigrants | Barbados | 0.0 /100 | #286 | Tragic 93.4% |
| Immigrants | St. Vincent and the Grenadines | 0.0 /100 | #287 | Tragic 93.4% |
| Immigrants | South Eastern Asia | 0.0 /100 | #288 | Tragic 93.3% |