Guyanese vs Tsimshian Professional Degree
COMPARE
Guyanese
Tsimshian
Professional Degree
Professional Degree Comparison
Guyanese
Tsimshian
3.8%
PROFESSIONAL DEGREE
1.6/ 100
METRIC RATING
247th/ 347
METRIC RANK
3.2%
PROFESSIONAL DEGREE
0.0/ 100
METRIC RATING
321st/ 347
METRIC RANK
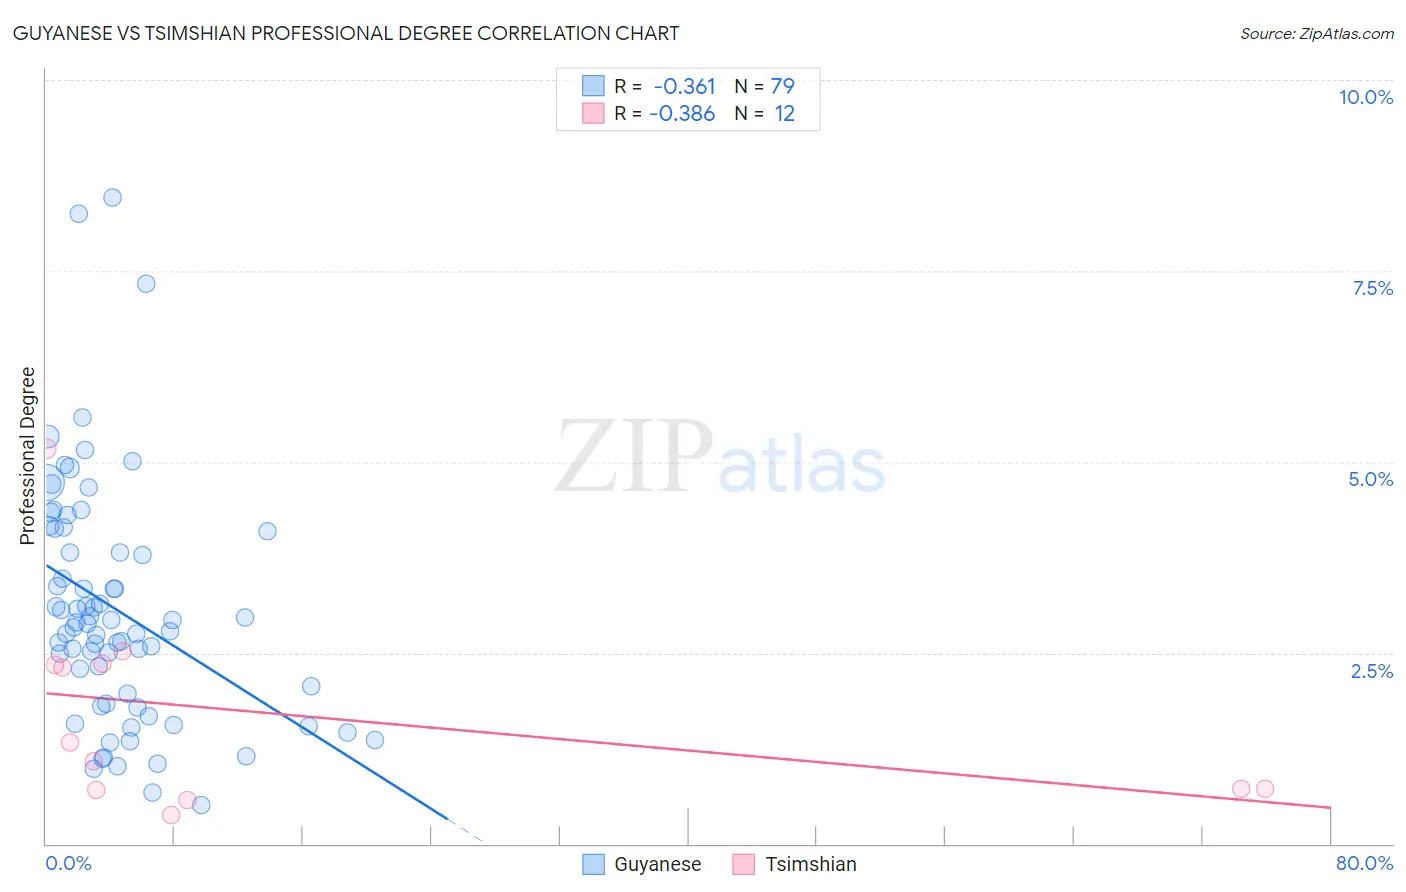
Guyanese vs Tsimshian Professional Degree Correlation Chart
The statistical analysis conducted on geographies consisting of 176,751,044 people shows a mild negative correlation between the proportion of Guyanese and percentage of population with at least professional degree education in the United States with a correlation coefficient (R) of -0.361 and weighted average of 3.8%. Similarly, the statistical analysis conducted on geographies consisting of 15,614,727 people shows a mild negative correlation between the proportion of Tsimshian and percentage of population with at least professional degree education in the United States with a correlation coefficient (R) of -0.386 and weighted average of 3.2%, a difference of 17.9%.
Professional Degree Correlation Summary
| Measurement | Guyanese | Tsimshian |
| Minimum | 0.51% | 0.38% |
| Maximum | 8.5% | 5.2% |
| Range | 8.0% | 4.8% |
| Mean | 3.1% | 1.7% |
| Median | 2.9% | 1.2% |
| Interquartile 25% (IQ1) | 1.8% | 0.71% |
| Interquartile 75% (IQ3) | 4.1% | 2.4% |
| Interquartile Range (IQR) | 2.3% | 1.6% |
| Standard Deviation (Sample) | 1.6% | 1.4% |
| Standard Deviation (Population) | 1.6% | 1.3% |
Similar Demographics by Professional Degree
Demographics Similar to Guyanese by Professional Degree
In terms of professional degree, the demographic groups most similar to Guyanese are Marshallese (3.8%, a difference of 0.020%), Hmong (3.7%, a difference of 0.16%), French American Indian (3.8%, a difference of 0.20%), Immigrants from Grenada (3.7%, a difference of 0.27%), and Immigrants from Fiji (3.7%, a difference of 0.34%).
| Demographics | Rating | Rank | Professional Degree |
| Immigrants | Ecuador | 2.3 /100 | #240 | Tragic 3.8% |
| Alaskan Athabascans | 2.3 /100 | #241 | Tragic 3.8% |
| Native Hawaiians | 2.3 /100 | #242 | Tragic 3.8% |
| Guamanians/Chamorros | 2.2 /100 | #243 | Tragic 3.8% |
| Immigrants | Bahamas | 2.0 /100 | #244 | Tragic 3.8% |
| French American Indians | 1.7 /100 | #245 | Tragic 3.8% |
| Marshallese | 1.7 /100 | #246 | Tragic 3.8% |
| Guyanese | 1.6 /100 | #247 | Tragic 3.8% |
| Hmong | 1.6 /100 | #248 | Tragic 3.7% |
| Immigrants | Grenada | 1.5 /100 | #249 | Tragic 3.7% |
| Immigrants | Fiji | 1.5 /100 | #250 | Tragic 3.7% |
| Immigrants | Nicaragua | 1.4 /100 | #251 | Tragic 3.7% |
| Jamaicans | 1.4 /100 | #252 | Tragic 3.7% |
| Pueblo | 1.4 /100 | #253 | Tragic 3.7% |
| Tongans | 1.3 /100 | #254 | Tragic 3.7% |
Demographics Similar to Tsimshian by Professional Degree
In terms of professional degree, the demographic groups most similar to Tsimshian are Seminole (3.2%, a difference of 0.36%), Hispanic or Latino (3.2%, a difference of 0.36%), Inupiat (3.2%, a difference of 0.44%), Crow (3.2%, a difference of 0.72%), and Yaqui (3.2%, a difference of 0.78%).
| Demographics | Rating | Rank | Professional Degree |
| Mexican American Indians | 0.1 /100 | #314 | Tragic 3.3% |
| Immigrants | Laos | 0.1 /100 | #315 | Tragic 3.2% |
| Puerto Ricans | 0.1 /100 | #316 | Tragic 3.2% |
| Nepalese | 0.1 /100 | #317 | Tragic 3.2% |
| Immigrants | Micronesia | 0.1 /100 | #318 | Tragic 3.2% |
| Choctaw | 0.1 /100 | #319 | Tragic 3.2% |
| Seminole | 0.1 /100 | #320 | Tragic 3.2% |
| Tsimshian | 0.0 /100 | #321 | Tragic 3.2% |
| Hispanics or Latinos | 0.0 /100 | #322 | Tragic 3.2% |
| Inupiat | 0.0 /100 | #323 | Tragic 3.2% |
| Crow | 0.0 /100 | #324 | Tragic 3.2% |
| Yaqui | 0.0 /100 | #325 | Tragic 3.2% |
| Menominee | 0.0 /100 | #326 | Tragic 3.1% |
| Dutch West Indians | 0.0 /100 | #327 | Tragic 3.1% |
| Creek | 0.0 /100 | #328 | Tragic 3.1% |