Shoshone vs Immigrants from Sudan Professional Degree
COMPARE
Shoshone
Immigrants from Sudan
Professional Degree
Professional Degree Comparison
Shoshone
Immigrants from Sudan
3.3%
PROFESSIONAL DEGREE
0.1/ 100
METRIC RATING
308th/ 347
METRIC RANK
4.9%
PROFESSIONAL DEGREE
95.4/ 100
METRIC RATING
119th/ 347
METRIC RANK
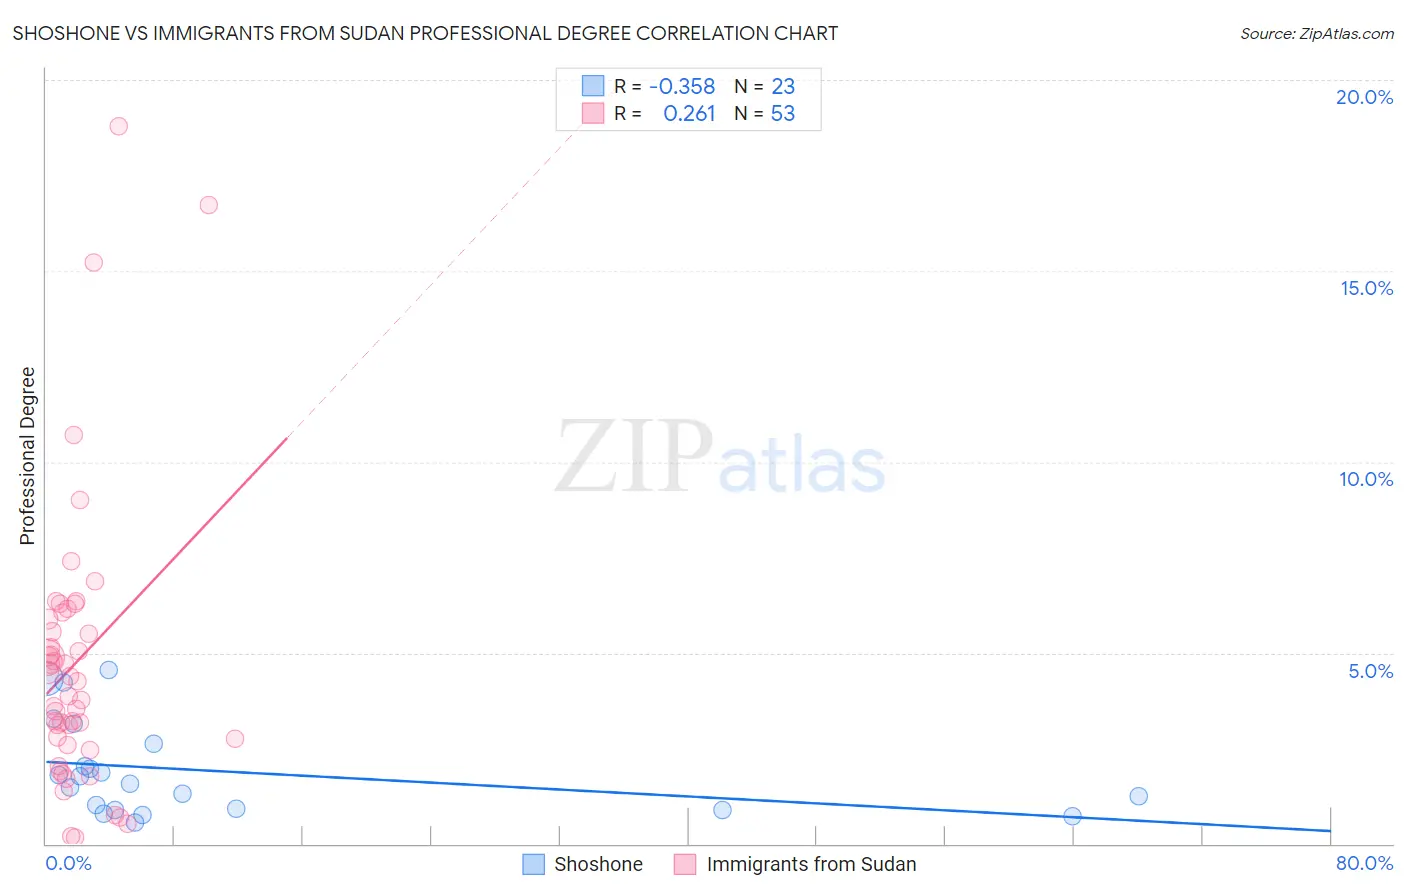
Shoshone vs Immigrants from Sudan Professional Degree Correlation Chart
The statistical analysis conducted on geographies consisting of 66,513,785 people shows a mild negative correlation between the proportion of Shoshone and percentage of population with at least professional degree education in the United States with a correlation coefficient (R) of -0.358 and weighted average of 3.3%. Similarly, the statistical analysis conducted on geographies consisting of 118,905,471 people shows a weak positive correlation between the proportion of Immigrants from Sudan and percentage of population with at least professional degree education in the United States with a correlation coefficient (R) of 0.261 and weighted average of 4.9%, a difference of 47.8%.
Professional Degree Correlation Summary
| Measurement | Shoshone | Immigrants from Sudan |
| Minimum | 0.57% | 0.17% |
| Maximum | 4.6% | 18.8% |
| Range | 4.0% | 18.6% |
| Mean | 1.9% | 4.8% |
| Median | 1.6% | 4.2% |
| Interquartile 25% (IQ1) | 0.89% | 2.7% |
| Interquartile 75% (IQ3) | 2.6% | 6.0% |
| Interquartile Range (IQR) | 1.7% | 3.3% |
| Standard Deviation (Sample) | 1.2% | 3.7% |
| Standard Deviation (Population) | 1.2% | 3.7% |
Similar Demographics by Professional Degree
Demographics Similar to Shoshone by Professional Degree
In terms of professional degree, the demographic groups most similar to Shoshone are Pima (3.3%, a difference of 0.010%), Immigrants from Latin America (3.3%, a difference of 0.33%), Cherokee (3.3%, a difference of 0.48%), Samoan (3.3%, a difference of 0.50%), and Sioux (3.3%, a difference of 1.1%).
| Demographics | Rating | Rank | Professional Degree |
| Immigrants | Dominican Republic | 0.2 /100 | #301 | Tragic 3.4% |
| Malaysians | 0.2 /100 | #302 | Tragic 3.4% |
| Immigrants | Haiti | 0.2 /100 | #303 | Tragic 3.4% |
| Cajuns | 0.2 /100 | #304 | Tragic 3.4% |
| Chickasaw | 0.1 /100 | #305 | Tragic 3.4% |
| Cape Verdeans | 0.1 /100 | #306 | Tragic 3.4% |
| Samoans | 0.1 /100 | #307 | Tragic 3.3% |
| Shoshone | 0.1 /100 | #308 | Tragic 3.3% |
| Pima | 0.1 /100 | #309 | Tragic 3.3% |
| Immigrants | Latin America | 0.1 /100 | #310 | Tragic 3.3% |
| Cherokee | 0.1 /100 | #311 | Tragic 3.3% |
| Sioux | 0.1 /100 | #312 | Tragic 3.3% |
| Yuman | 0.1 /100 | #313 | Tragic 3.3% |
| Mexican American Indians | 0.1 /100 | #314 | Tragic 3.3% |
| Immigrants | Laos | 0.1 /100 | #315 | Tragic 3.2% |
Demographics Similar to Immigrants from Sudan by Professional Degree
In terms of professional degree, the demographic groups most similar to Immigrants from Sudan are Albanian (4.9%, a difference of 0.010%), Immigrants from Moldova (4.9%, a difference of 0.36%), Immigrants from Syria (4.9%, a difference of 0.54%), Croatian (4.9%, a difference of 0.54%), and Venezuelan (4.9%, a difference of 0.75%).
| Demographics | Rating | Rank | Professional Degree |
| Taiwanese | 97.3 /100 | #112 | Exceptional 5.0% |
| Immigrants | Pakistan | 97.2 /100 | #113 | Exceptional 5.0% |
| Immigrants | Morocco | 96.8 /100 | #114 | Exceptional 5.0% |
| Moroccans | 96.8 /100 | #115 | Exceptional 5.0% |
| Venezuelans | 96.3 /100 | #116 | Exceptional 4.9% |
| Immigrants | Syria | 96.0 /100 | #117 | Exceptional 4.9% |
| Croatians | 96.0 /100 | #118 | Exceptional 4.9% |
| Immigrants | Sudan | 95.4 /100 | #119 | Exceptional 4.9% |
| Albanians | 95.3 /100 | #120 | Exceptional 4.9% |
| Immigrants | Moldova | 94.8 /100 | #121 | Exceptional 4.9% |
| Immigrants | Germany | 94.1 /100 | #122 | Exceptional 4.9% |
| Immigrants | Venezuela | 93.8 /100 | #123 | Exceptional 4.8% |
| Immigrants | Eritrea | 93.5 /100 | #124 | Exceptional 4.8% |
| Immigrants | Albania | 93.3 /100 | #125 | Exceptional 4.8% |
| Europeans | 93.2 /100 | #126 | Exceptional 4.8% |