Guyanese vs Immigrants from Egypt Professional Degree
COMPARE
Guyanese
Immigrants from Egypt
Professional Degree
Professional Degree Comparison
Guyanese
Immigrants from Egypt
3.8%
PROFESSIONAL DEGREE
1.6/ 100
METRIC RATING
247th/ 347
METRIC RANK
5.1%
PROFESSIONAL DEGREE
98.5/ 100
METRIC RATING
101st/ 347
METRIC RANK
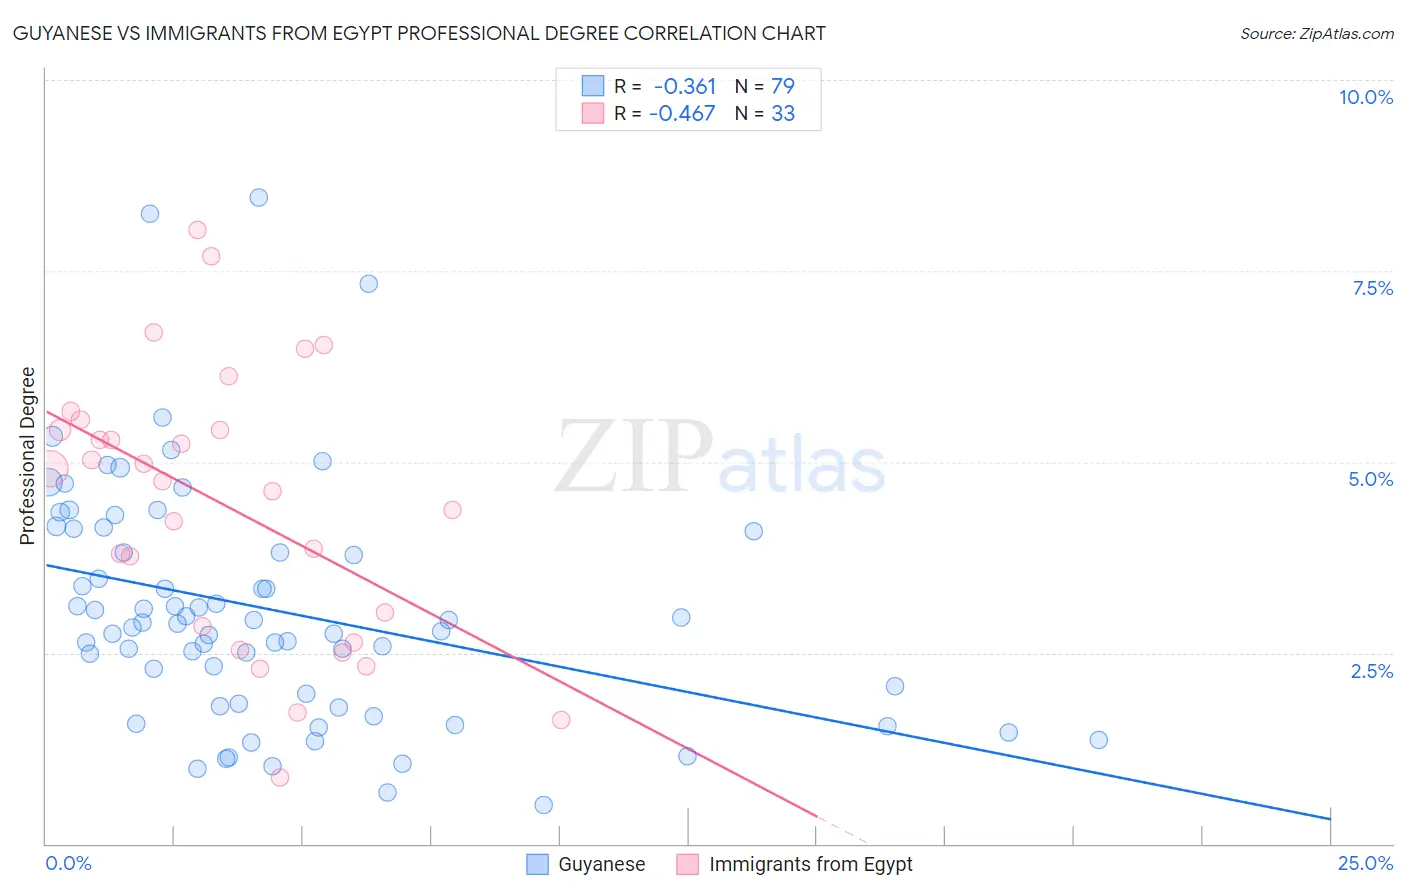
Guyanese vs Immigrants from Egypt Professional Degree Correlation Chart
The statistical analysis conducted on geographies consisting of 176,751,044 people shows a mild negative correlation between the proportion of Guyanese and percentage of population with at least professional degree education in the United States with a correlation coefficient (R) of -0.361 and weighted average of 3.8%. Similarly, the statistical analysis conducted on geographies consisting of 245,381,145 people shows a moderate negative correlation between the proportion of Immigrants from Egypt and percentage of population with at least professional degree education in the United States with a correlation coefficient (R) of -0.467 and weighted average of 5.1%, a difference of 35.3%.
Professional Degree Correlation Summary
| Measurement | Guyanese | Immigrants from Egypt |
| Minimum | 0.51% | 0.86% |
| Maximum | 8.5% | 8.0% |
| Range | 8.0% | 7.2% |
| Mean | 3.1% | 4.4% |
| Median | 2.9% | 4.7% |
| Interquartile 25% (IQ1) | 1.8% | 2.7% |
| Interquartile 75% (IQ3) | 4.1% | 5.5% |
| Interquartile Range (IQR) | 2.3% | 2.7% |
| Standard Deviation (Sample) | 1.6% | 1.8% |
| Standard Deviation (Population) | 1.6% | 1.8% |
Similar Demographics by Professional Degree
Demographics Similar to Guyanese by Professional Degree
In terms of professional degree, the demographic groups most similar to Guyanese are Marshallese (3.8%, a difference of 0.020%), Hmong (3.7%, a difference of 0.16%), French American Indian (3.8%, a difference of 0.20%), Immigrants from Grenada (3.7%, a difference of 0.27%), and Immigrants from Fiji (3.7%, a difference of 0.34%).
| Demographics | Rating | Rank | Professional Degree |
| Immigrants | Ecuador | 2.3 /100 | #240 | Tragic 3.8% |
| Alaskan Athabascans | 2.3 /100 | #241 | Tragic 3.8% |
| Native Hawaiians | 2.3 /100 | #242 | Tragic 3.8% |
| Guamanians/Chamorros | 2.2 /100 | #243 | Tragic 3.8% |
| Immigrants | Bahamas | 2.0 /100 | #244 | Tragic 3.8% |
| French American Indians | 1.7 /100 | #245 | Tragic 3.8% |
| Marshallese | 1.7 /100 | #246 | Tragic 3.8% |
| Guyanese | 1.6 /100 | #247 | Tragic 3.8% |
| Hmong | 1.6 /100 | #248 | Tragic 3.7% |
| Immigrants | Grenada | 1.5 /100 | #249 | Tragic 3.7% |
| Immigrants | Fiji | 1.5 /100 | #250 | Tragic 3.7% |
| Immigrants | Nicaragua | 1.4 /100 | #251 | Tragic 3.7% |
| Jamaicans | 1.4 /100 | #252 | Tragic 3.7% |
| Pueblo | 1.4 /100 | #253 | Tragic 3.7% |
| Tongans | 1.3 /100 | #254 | Tragic 3.7% |
Demographics Similar to Immigrants from Egypt by Professional Degree
In terms of professional degree, the demographic groups most similar to Immigrants from Egypt are Ukrainian (5.1%, a difference of 0.080%), Immigrants from Northern Africa (5.1%, a difference of 0.33%), Arab (5.0%, a difference of 0.64%), Immigrants from Uganda (5.0%, a difference of 0.67%), and Immigrants from Ukraine (5.0%, a difference of 0.69%).
| Demographics | Rating | Rank | Professional Degree |
| Alsatians | 99.3 /100 | #94 | Exceptional 5.2% |
| Zimbabweans | 99.3 /100 | #95 | Exceptional 5.2% |
| Immigrants | Uzbekistan | 99.2 /100 | #96 | Exceptional 5.2% |
| Syrians | 99.1 /100 | #97 | Exceptional 5.2% |
| Austrians | 99.1 /100 | #98 | Exceptional 5.2% |
| Immigrants | Italy | 99.1 /100 | #99 | Exceptional 5.2% |
| Ugandans | 98.8 /100 | #100 | Exceptional 5.1% |
| Immigrants | Egypt | 98.5 /100 | #101 | Exceptional 5.1% |
| Ukrainians | 98.5 /100 | #102 | Exceptional 5.1% |
| Immigrants | Northern Africa | 98.4 /100 | #103 | Exceptional 5.1% |
| Arabs | 98.2 /100 | #104 | Exceptional 5.0% |
| Immigrants | Uganda | 98.2 /100 | #105 | Exceptional 5.0% |
| Immigrants | Ukraine | 98.2 /100 | #106 | Exceptional 5.0% |
| Maltese | 98.1 /100 | #107 | Exceptional 5.0% |
| Immigrants | Southern Europe | 98.1 /100 | #108 | Exceptional 5.0% |