Guyanese vs Chickasaw Professional Degree
COMPARE
Guyanese
Chickasaw
Professional Degree
Professional Degree Comparison
Guyanese
Chickasaw
3.8%
PROFESSIONAL DEGREE
1.6/ 100
METRIC RATING
247th/ 347
METRIC RANK
3.4%
PROFESSIONAL DEGREE
0.1/ 100
METRIC RATING
305th/ 347
METRIC RANK
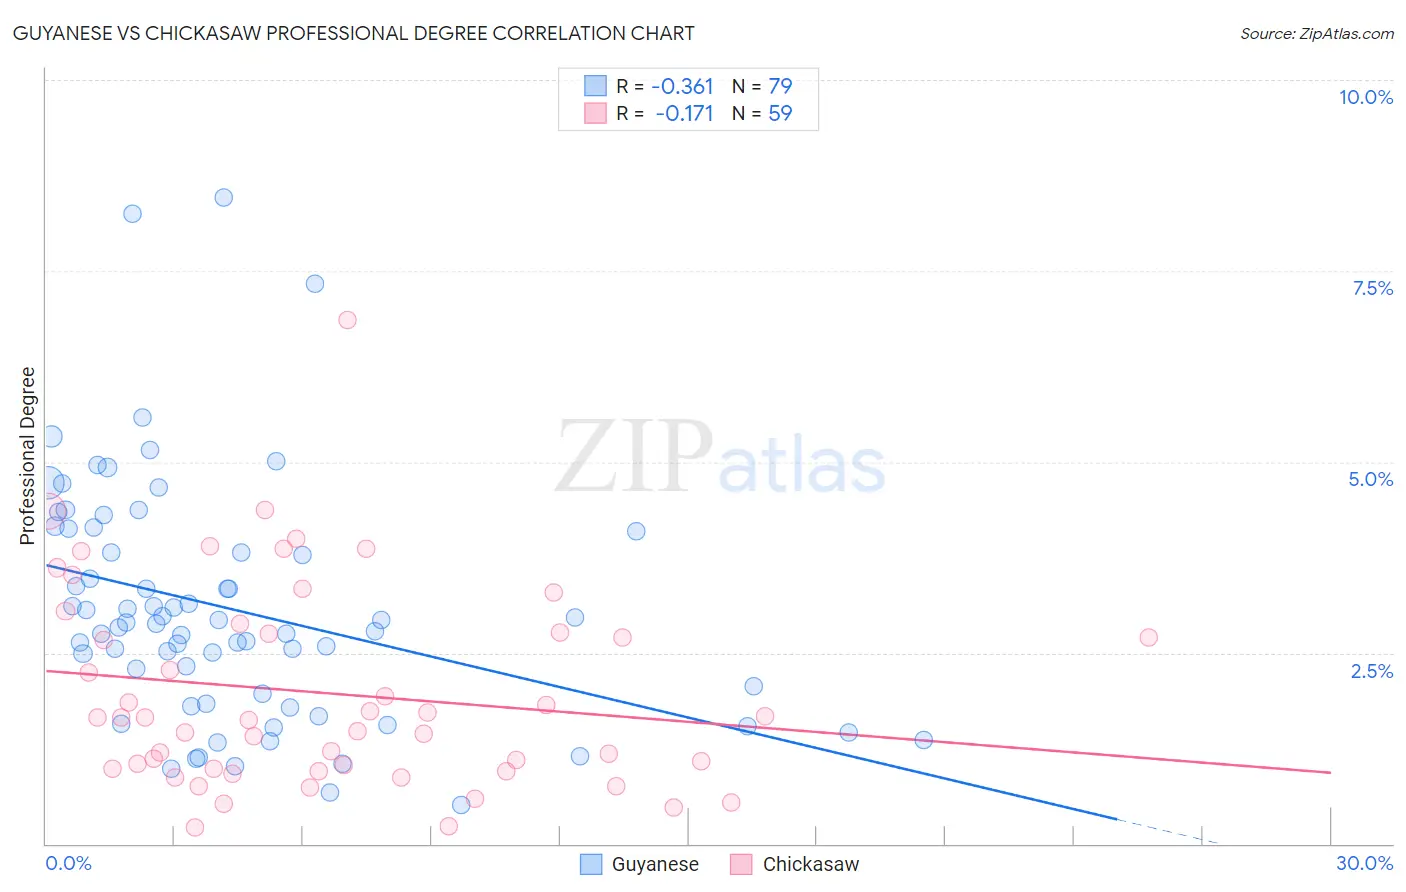
Guyanese vs Chickasaw Professional Degree Correlation Chart
The statistical analysis conducted on geographies consisting of 176,751,044 people shows a mild negative correlation between the proportion of Guyanese and percentage of population with at least professional degree education in the United States with a correlation coefficient (R) of -0.361 and weighted average of 3.8%. Similarly, the statistical analysis conducted on geographies consisting of 147,338,770 people shows a poor negative correlation between the proportion of Chickasaw and percentage of population with at least professional degree education in the United States with a correlation coefficient (R) of -0.171 and weighted average of 3.4%, a difference of 11.6%.
Professional Degree Correlation Summary
| Measurement | Guyanese | Chickasaw |
| Minimum | 0.51% | 0.21% |
| Maximum | 8.5% | 6.9% |
| Range | 8.0% | 6.6% |
| Mean | 3.1% | 2.0% |
| Median | 2.9% | 1.6% |
| Interquartile 25% (IQ1) | 1.8% | 0.98% |
| Interquartile 75% (IQ3) | 4.1% | 2.8% |
| Interquartile Range (IQR) | 2.3% | 1.8% |
| Standard Deviation (Sample) | 1.6% | 1.3% |
| Standard Deviation (Population) | 1.6% | 1.3% |
Similar Demographics by Professional Degree
Demographics Similar to Guyanese by Professional Degree
In terms of professional degree, the demographic groups most similar to Guyanese are Marshallese (3.8%, a difference of 0.020%), Hmong (3.7%, a difference of 0.16%), French American Indian (3.8%, a difference of 0.20%), Immigrants from Grenada (3.7%, a difference of 0.27%), and Immigrants from Fiji (3.7%, a difference of 0.34%).
| Demographics | Rating | Rank | Professional Degree |
| Immigrants | Ecuador | 2.3 /100 | #240 | Tragic 3.8% |
| Alaskan Athabascans | 2.3 /100 | #241 | Tragic 3.8% |
| Native Hawaiians | 2.3 /100 | #242 | Tragic 3.8% |
| Guamanians/Chamorros | 2.2 /100 | #243 | Tragic 3.8% |
| Immigrants | Bahamas | 2.0 /100 | #244 | Tragic 3.8% |
| French American Indians | 1.7 /100 | #245 | Tragic 3.8% |
| Marshallese | 1.7 /100 | #246 | Tragic 3.8% |
| Guyanese | 1.6 /100 | #247 | Tragic 3.8% |
| Hmong | 1.6 /100 | #248 | Tragic 3.7% |
| Immigrants | Grenada | 1.5 /100 | #249 | Tragic 3.7% |
| Immigrants | Fiji | 1.5 /100 | #250 | Tragic 3.7% |
| Immigrants | Nicaragua | 1.4 /100 | #251 | Tragic 3.7% |
| Jamaicans | 1.4 /100 | #252 | Tragic 3.7% |
| Pueblo | 1.4 /100 | #253 | Tragic 3.7% |
| Tongans | 1.3 /100 | #254 | Tragic 3.7% |
Demographics Similar to Chickasaw by Professional Degree
In terms of professional degree, the demographic groups most similar to Chickasaw are Cape Verdean (3.4%, a difference of 0.010%), Cajun (3.4%, a difference of 0.30%), Immigrants from Haiti (3.4%, a difference of 0.31%), Malaysian (3.4%, a difference of 0.97%), and Samoan (3.3%, a difference of 1.1%).
| Demographics | Rating | Rank | Professional Degree |
| Ottawa | 0.2 /100 | #298 | Tragic 3.4% |
| Immigrants | Yemen | 0.2 /100 | #299 | Tragic 3.4% |
| Blacks/African Americans | 0.2 /100 | #300 | Tragic 3.4% |
| Immigrants | Dominican Republic | 0.2 /100 | #301 | Tragic 3.4% |
| Malaysians | 0.2 /100 | #302 | Tragic 3.4% |
| Immigrants | Haiti | 0.2 /100 | #303 | Tragic 3.4% |
| Cajuns | 0.2 /100 | #304 | Tragic 3.4% |
| Chickasaw | 0.1 /100 | #305 | Tragic 3.4% |
| Cape Verdeans | 0.1 /100 | #306 | Tragic 3.4% |
| Samoans | 0.1 /100 | #307 | Tragic 3.3% |
| Shoshone | 0.1 /100 | #308 | Tragic 3.3% |
| Pima | 0.1 /100 | #309 | Tragic 3.3% |
| Immigrants | Latin America | 0.1 /100 | #310 | Tragic 3.3% |
| Cherokee | 0.1 /100 | #311 | Tragic 3.3% |
| Sioux | 0.1 /100 | #312 | Tragic 3.3% |