Afghan vs Immigrants from Cabo Verde Doctorate Degree
COMPARE
Afghan
Immigrants from Cabo Verde
Doctorate Degree
Doctorate Degree Comparison
Afghans
Immigrants from Cabo Verde
2.0%
DOCTORATE DEGREE
87.2/ 100
METRIC RATING
139th/ 347
METRIC RANK
1.3%
DOCTORATE DEGREE
0.0/ 100
METRIC RATING
326th/ 347
METRIC RANK
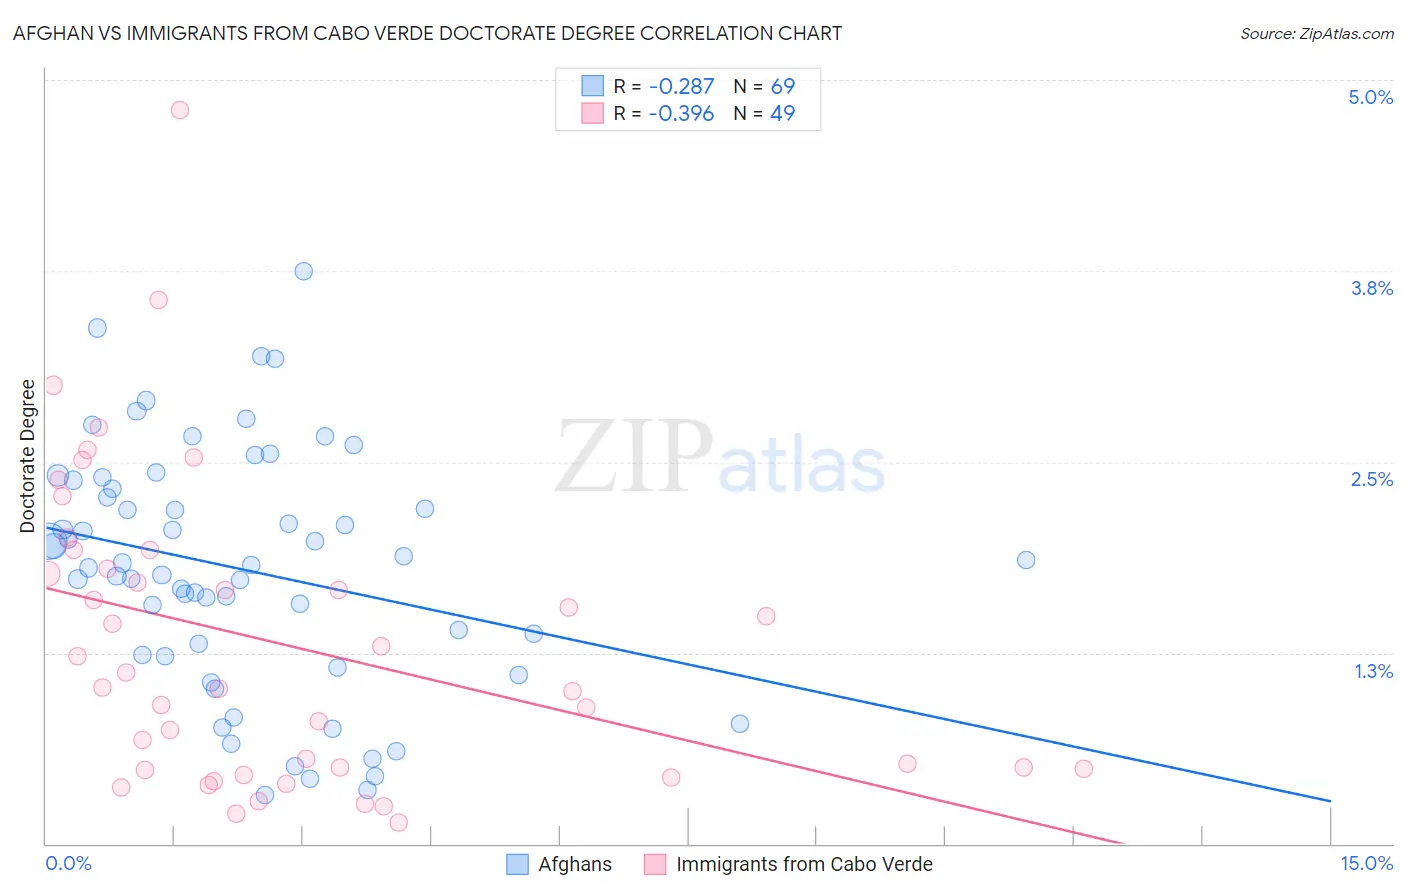
Afghan vs Immigrants from Cabo Verde Doctorate Degree Correlation Chart
The statistical analysis conducted on geographies consisting of 148,659,746 people shows a weak negative correlation between the proportion of Afghans and percentage of population with at least doctorate degree education in the United States with a correlation coefficient (R) of -0.287 and weighted average of 2.0%. Similarly, the statistical analysis conducted on geographies consisting of 38,072,290 people shows a mild negative correlation between the proportion of Immigrants from Cabo Verde and percentage of population with at least doctorate degree education in the United States with a correlation coefficient (R) of -0.396 and weighted average of 1.3%, a difference of 49.3%.
Doctorate Degree Correlation Summary
| Measurement | Afghan | Immigrants from Cabo Verde |
| Minimum | 0.32% | 0.14% |
| Maximum | 3.7% | 4.8% |
| Range | 3.4% | 4.7% |
| Mean | 1.8% | 1.3% |
| Median | 1.8% | 1.0% |
| Interquartile 25% (IQ1) | 1.2% | 0.49% |
| Interquartile 75% (IQ3) | 2.4% | 1.9% |
| Interquartile Range (IQR) | 1.1% | 1.4% |
| Standard Deviation (Sample) | 0.79% | 0.99% |
| Standard Deviation (Population) | 0.78% | 0.98% |
Similar Demographics by Doctorate Degree
Demographics Similar to Afghans by Doctorate Degree
In terms of doctorate degree, the demographic groups most similar to Afghans are Immigrants from Africa (2.0%, a difference of 0.080%), Senegalese (2.0%, a difference of 0.16%), Swiss (2.0%, a difference of 0.23%), Swedish (2.0%, a difference of 0.32%), and South American Indian (2.0%, a difference of 0.32%).
| Demographics | Rating | Rank | Doctorate Degree |
| Scottish | 89.4 /100 | #132 | Excellent 2.0% |
| Immigrants | Uzbekistan | 89.3 /100 | #133 | Excellent 2.0% |
| Immigrants | Cameroon | 88.9 /100 | #134 | Excellent 2.0% |
| Serbians | 88.7 /100 | #135 | Excellent 2.0% |
| Swedes | 88.3 /100 | #136 | Excellent 2.0% |
| South American Indians | 88.3 /100 | #137 | Excellent 2.0% |
| Swiss | 88.0 /100 | #138 | Excellent 2.0% |
| Afghans | 87.2 /100 | #139 | Excellent 2.0% |
| Immigrants | Africa | 87.0 /100 | #140 | Excellent 2.0% |
| Senegalese | 86.7 /100 | #141 | Excellent 2.0% |
| Italians | 86.0 /100 | #142 | Excellent 2.0% |
| Sierra Leoneans | 85.1 /100 | #143 | Excellent 2.0% |
| Immigrants | Moldova | 84.3 /100 | #144 | Excellent 2.0% |
| Kenyans | 83.6 /100 | #145 | Excellent 1.9% |
| Immigrants | Syria | 83.6 /100 | #146 | Excellent 1.9% |
Demographics Similar to Immigrants from Cabo Verde by Doctorate Degree
In terms of doctorate degree, the demographic groups most similar to Immigrants from Cabo Verde are Pima (1.3%, a difference of 0.020%), Hispanic or Latino (1.3%, a difference of 0.29%), Native/Alaskan (1.3%, a difference of 0.41%), Immigrants from Belize (1.3%, a difference of 0.74%), and Inupiat (1.3%, a difference of 0.87%).
| Demographics | Rating | Rank | Doctorate Degree |
| Immigrants | Guyana | 0.1 /100 | #319 | Tragic 1.3% |
| Immigrants | St. Vincent and the Grenadines | 0.1 /100 | #320 | Tragic 1.3% |
| Dutch West Indians | 0.1 /100 | #321 | Tragic 1.3% |
| Seminole | 0.1 /100 | #322 | Tragic 1.3% |
| Immigrants | Belize | 0.1 /100 | #323 | Tragic 1.3% |
| Natives/Alaskans | 0.0 /100 | #324 | Tragic 1.3% |
| Pima | 0.0 /100 | #325 | Tragic 1.3% |
| Immigrants | Cabo Verde | 0.0 /100 | #326 | Tragic 1.3% |
| Hispanics or Latinos | 0.0 /100 | #327 | Tragic 1.3% |
| Inupiat | 0.0 /100 | #328 | Tragic 1.3% |
| Haitians | 0.0 /100 | #329 | Tragic 1.3% |
| Yup'ik | 0.0 /100 | #330 | Tragic 1.3% |
| Immigrants | Latin America | 0.0 /100 | #331 | Tragic 1.3% |
| Yakama | 0.0 /100 | #332 | Tragic 1.3% |
| Immigrants | Caribbean | 0.0 /100 | #333 | Tragic 1.3% |