Guamanian/Chamorro vs Czech Doctorate Degree
COMPARE
Guamanian/Chamorro
Czech
Doctorate Degree
Doctorate Degree Comparison
Guamanians/Chamorros
Czechs
1.6%
DOCTORATE DEGREE
3.3/ 100
METRIC RATING
232nd/ 347
METRIC RANK
1.9%
DOCTORATE DEGREE
67.3/ 100
METRIC RATING
163rd/ 347
METRIC RANK
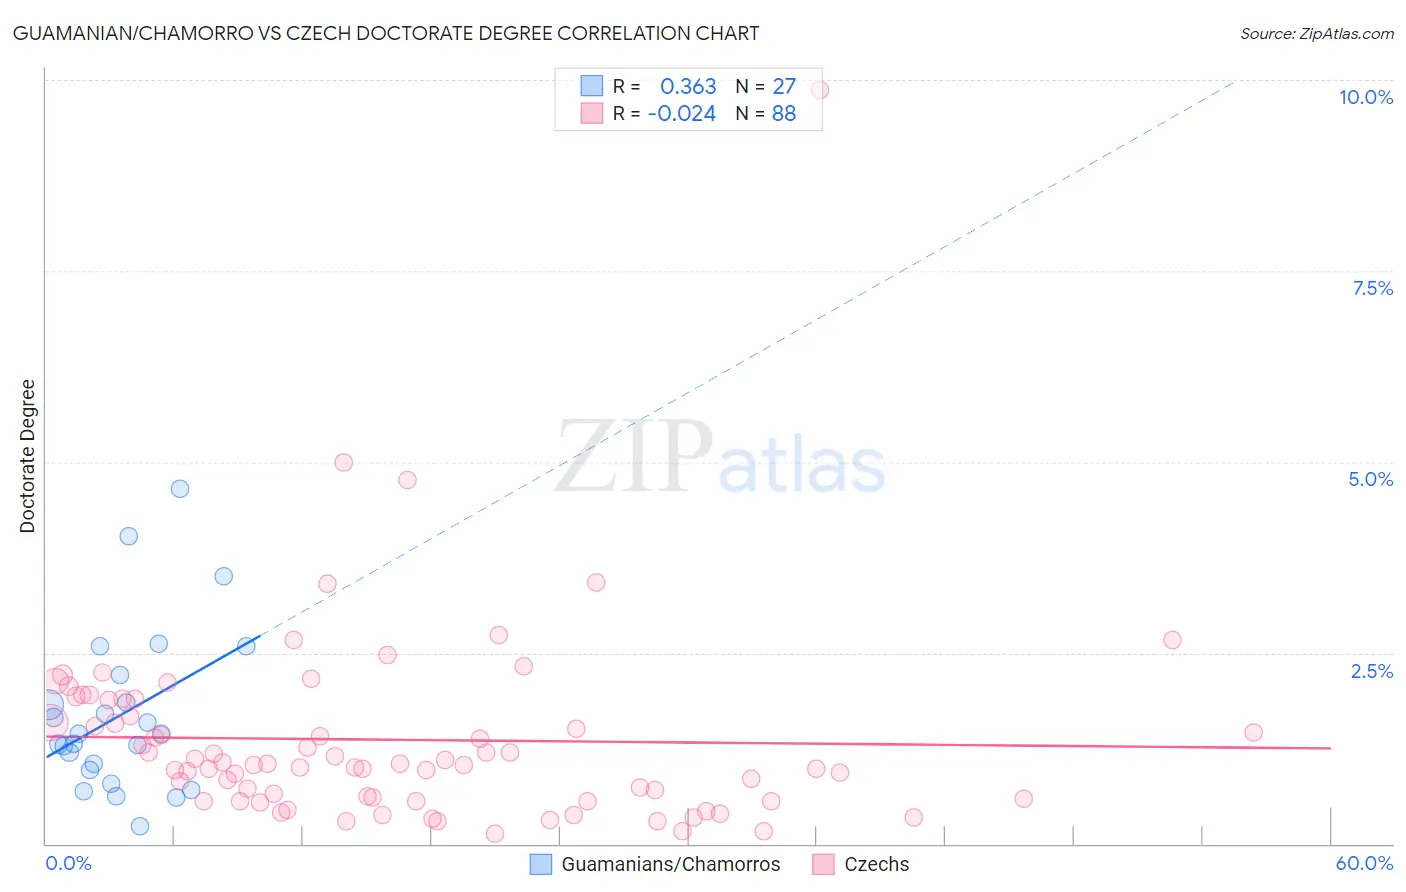
Guamanian/Chamorro vs Czech Doctorate Degree Correlation Chart
The statistical analysis conducted on geographies consisting of 220,575,272 people shows a mild positive correlation between the proportion of Guamanians/Chamorros and percentage of population with at least doctorate degree education in the United States with a correlation coefficient (R) of 0.363 and weighted average of 1.6%. Similarly, the statistical analysis conducted on geographies consisting of 474,197,515 people shows no correlation between the proportion of Czechs and percentage of population with at least doctorate degree education in the United States with a correlation coefficient (R) of -0.024 and weighted average of 1.9%, a difference of 17.1%.
Doctorate Degree Correlation Summary
| Measurement | Guamanian/Chamorro | Czech |
| Minimum | 0.23% | 0.13% |
| Maximum | 4.6% | 9.9% |
| Range | 4.4% | 9.7% |
| Mean | 1.7% | 1.4% |
| Median | 1.4% | 1.0% |
| Interquartile 25% (IQ1) | 0.97% | 0.58% |
| Interquartile 75% (IQ3) | 2.2% | 1.8% |
| Interquartile Range (IQR) | 1.2% | 1.2% |
| Standard Deviation (Sample) | 1.1% | 1.3% |
| Standard Deviation (Population) | 1.0% | 1.3% |
Similar Demographics by Doctorate Degree
Demographics Similar to Guamanians/Chamorros by Doctorate Degree
In terms of doctorate degree, the demographic groups most similar to Guamanians/Chamorros are Barbadian (1.6%, a difference of 0.070%), Hopi (1.6%, a difference of 0.21%), Cree (1.6%, a difference of 0.43%), Immigrants from North Macedonia (1.6%, a difference of 0.69%), and Indonesian (1.6%, a difference of 0.71%).
| Demographics | Rating | Rank | Doctorate Degree |
| Immigrants | Colombia | 6.7 /100 | #225 | Tragic 1.7% |
| Osage | 6.5 /100 | #226 | Tragic 1.7% |
| Panamanians | 6.3 /100 | #227 | Tragic 1.7% |
| Assyrians/Chaldeans/Syriacs | 5.9 /100 | #228 | Tragic 1.7% |
| Colville | 4.7 /100 | #229 | Tragic 1.6% |
| Immigrants | Philippines | 4.3 /100 | #230 | Tragic 1.6% |
| Immigrants | North Macedonia | 3.9 /100 | #231 | Tragic 1.6% |
| Guamanians/Chamorros | 3.3 /100 | #232 | Tragic 1.6% |
| Barbadians | 3.3 /100 | #233 | Tragic 1.6% |
| Hopi | 3.2 /100 | #234 | Tragic 1.6% |
| Cree | 3.0 /100 | #235 | Tragic 1.6% |
| Indonesians | 2.8 /100 | #236 | Tragic 1.6% |
| Iroquois | 2.7 /100 | #237 | Tragic 1.6% |
| Immigrants | Congo | 2.6 /100 | #238 | Tragic 1.6% |
| West Indians | 2.5 /100 | #239 | Tragic 1.6% |
Demographics Similar to Czechs by Doctorate Degree
In terms of doctorate degree, the demographic groups most similar to Czechs are Irish (1.9%, a difference of 0.040%), Celtic (1.9%, a difference of 0.10%), Immigrants from Middle Africa (1.9%, a difference of 0.25%), Welsh (1.9%, a difference of 0.40%), and Slovene (1.9%, a difference of 0.49%).
| Demographics | Rating | Rank | Doctorate Degree |
| Slavs | 72.4 /100 | #156 | Good 1.9% |
| Danes | 71.9 /100 | #157 | Good 1.9% |
| Hungarians | 71.7 /100 | #158 | Good 1.9% |
| Slovenes | 70.2 /100 | #159 | Good 1.9% |
| Welsh | 69.7 /100 | #160 | Good 1.9% |
| Immigrants | Middle Africa | 68.8 /100 | #161 | Good 1.9% |
| Irish | 67.5 /100 | #162 | Good 1.9% |
| Czechs | 67.3 /100 | #163 | Good 1.9% |
| Celtics | 66.7 /100 | #164 | Good 1.9% |
| Scotch-Irish | 63.6 /100 | #165 | Good 1.9% |
| Spaniards | 63.5 /100 | #166 | Good 1.9% |
| Macedonians | 60.9 /100 | #167 | Good 1.9% |
| Sri Lankans | 60.3 /100 | #168 | Good 1.9% |
| Vietnamese | 54.8 /100 | #169 | Average 1.9% |
| Costa Ricans | 53.3 /100 | #170 | Average 1.8% |