Immigrants from Bangladesh vs Immigrants from Belize 12th Grade, No Diploma
COMPARE
Immigrants from Bangladesh
Immigrants from Belize
12th Grade, No Diploma
12th Grade, No Diploma Comparison
Immigrants from Bangladesh
Immigrants from Belize
88.0%
12TH GRADE, NO DIPLOMA
0.0/ 100
METRIC RATING
303rd/ 347
METRIC RANK
87.0%
12TH GRADE, NO DIPLOMA
0.0/ 100
METRIC RATING
319th/ 347
METRIC RANK
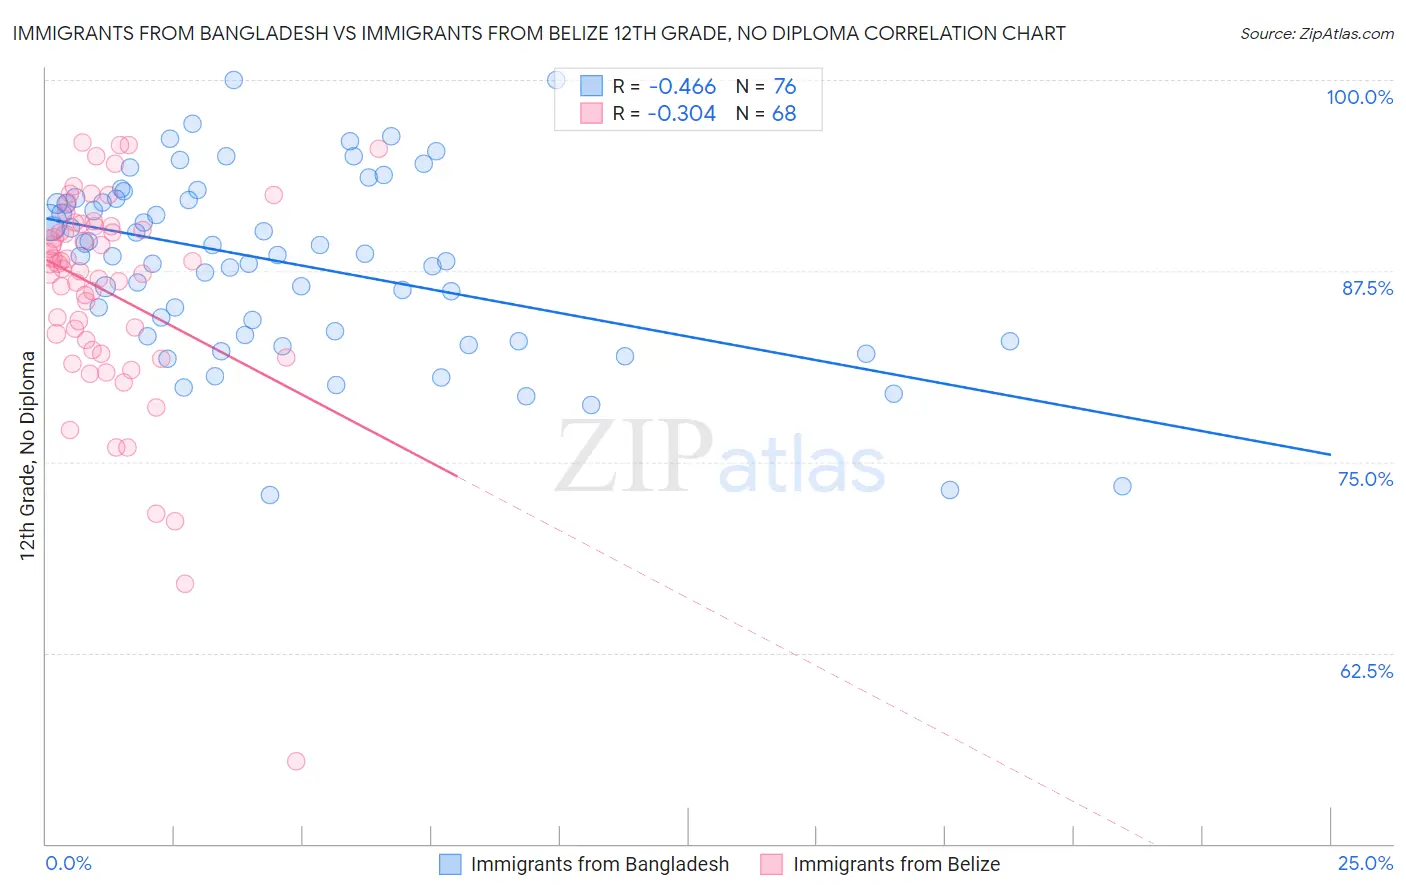
Immigrants from Bangladesh vs Immigrants from Belize 12th Grade, No Diploma Correlation Chart
The statistical analysis conducted on geographies consisting of 203,672,706 people shows a moderate negative correlation between the proportion of Immigrants from Bangladesh and percentage of population with at least 12th grade (no diploma) education in the United States with a correlation coefficient (R) of -0.466 and weighted average of 88.0%. Similarly, the statistical analysis conducted on geographies consisting of 130,181,087 people shows a mild negative correlation between the proportion of Immigrants from Belize and percentage of population with at least 12th grade (no diploma) education in the United States with a correlation coefficient (R) of -0.304 and weighted average of 87.0%, a difference of 1.1%.
12th Grade, No Diploma Correlation Summary
| Measurement | Immigrants from Bangladesh | Immigrants from Belize |
| Minimum | 72.9% | 55.4% |
| Maximum | 100.0% | 95.9% |
| Range | 27.1% | 40.5% |
| Mean | 88.0% | 86.1% |
| Median | 88.5% | 87.8% |
| Interquartile 25% (IQ1) | 83.3% | 82.6% |
| Interquartile 75% (IQ3) | 92.2% | 90.4% |
| Interquartile Range (IQR) | 8.9% | 7.8% |
| Standard Deviation (Sample) | 6.0% | 7.1% |
| Standard Deviation (Population) | 5.9% | 7.0% |
Demographics Similar to Immigrants from Bangladesh and Immigrants from Belize by 12th Grade, No Diploma
In terms of 12th grade, no diploma, the demographic groups most similar to Immigrants from Bangladesh are Vietnamese (87.9%, a difference of 0.060%), Ecuadorian (88.0%, a difference of 0.10%), Immigrants from Cambodia (88.1%, a difference of 0.13%), Immigrants from Dominica (87.7%, a difference of 0.26%), and Native/Alaskan (87.7%, a difference of 0.33%). Similarly, the demographic groups most similar to Immigrants from Belize are Belizean (87.0%, a difference of 0.080%), Navajo (87.1%, a difference of 0.14%), Apache (87.3%, a difference of 0.43%), Nicaraguan (87.3%, a difference of 0.44%), and Immigrants from Nicaragua (86.6%, a difference of 0.46%).
| Demographics | Rating | Rank | 12th Grade, No Diploma |
| Immigrants | Cambodia | 0.0 /100 | #301 | Tragic 88.1% |
| Ecuadorians | 0.0 /100 | #302 | Tragic 88.0% |
| Immigrants | Bangladesh | 0.0 /100 | #303 | Tragic 88.0% |
| Vietnamese | 0.0 /100 | #304 | Tragic 87.9% |
| Immigrants | Dominica | 0.0 /100 | #305 | Tragic 87.7% |
| Natives/Alaskans | 0.0 /100 | #306 | Tragic 87.7% |
| Immigrants | Portugal | 0.0 /100 | #307 | Tragic 87.6% |
| Yup'ik | 0.0 /100 | #308 | Tragic 87.6% |
| Immigrants | Armenia | 0.0 /100 | #309 | Tragic 87.6% |
| Immigrants | Cuba | 0.0 /100 | #310 | Tragic 87.5% |
| Yaqui | 0.0 /100 | #311 | Tragic 87.5% |
| Immigrants | Ecuador | 0.0 /100 | #312 | Tragic 87.5% |
| Immigrants | Caribbean | 0.0 /100 | #313 | Tragic 87.4% |
| Cape Verdeans | 0.0 /100 | #314 | Tragic 87.4% |
| Nicaraguans | 0.0 /100 | #315 | Tragic 87.3% |
| Apache | 0.0 /100 | #316 | Tragic 87.3% |
| Navajo | 0.0 /100 | #317 | Tragic 87.1% |
| Belizeans | 0.0 /100 | #318 | Tragic 87.0% |
| Immigrants | Belize | 0.0 /100 | #319 | Tragic 87.0% |
| Immigrants | Nicaragua | 0.0 /100 | #320 | Tragic 86.6% |
| Puerto Ricans | 0.0 /100 | #321 | Tragic 86.5% |