Jordanian vs Immigrants from Belize 12th Grade, No Diploma
COMPARE
Jordanian
Immigrants from Belize
12th Grade, No Diploma
12th Grade, No Diploma Comparison
Jordanians
Immigrants from Belize
92.2%
12TH GRADE, NO DIPLOMA
97.2/ 100
METRIC RATING
108th/ 347
METRIC RANK
87.0%
12TH GRADE, NO DIPLOMA
0.0/ 100
METRIC RATING
319th/ 347
METRIC RANK
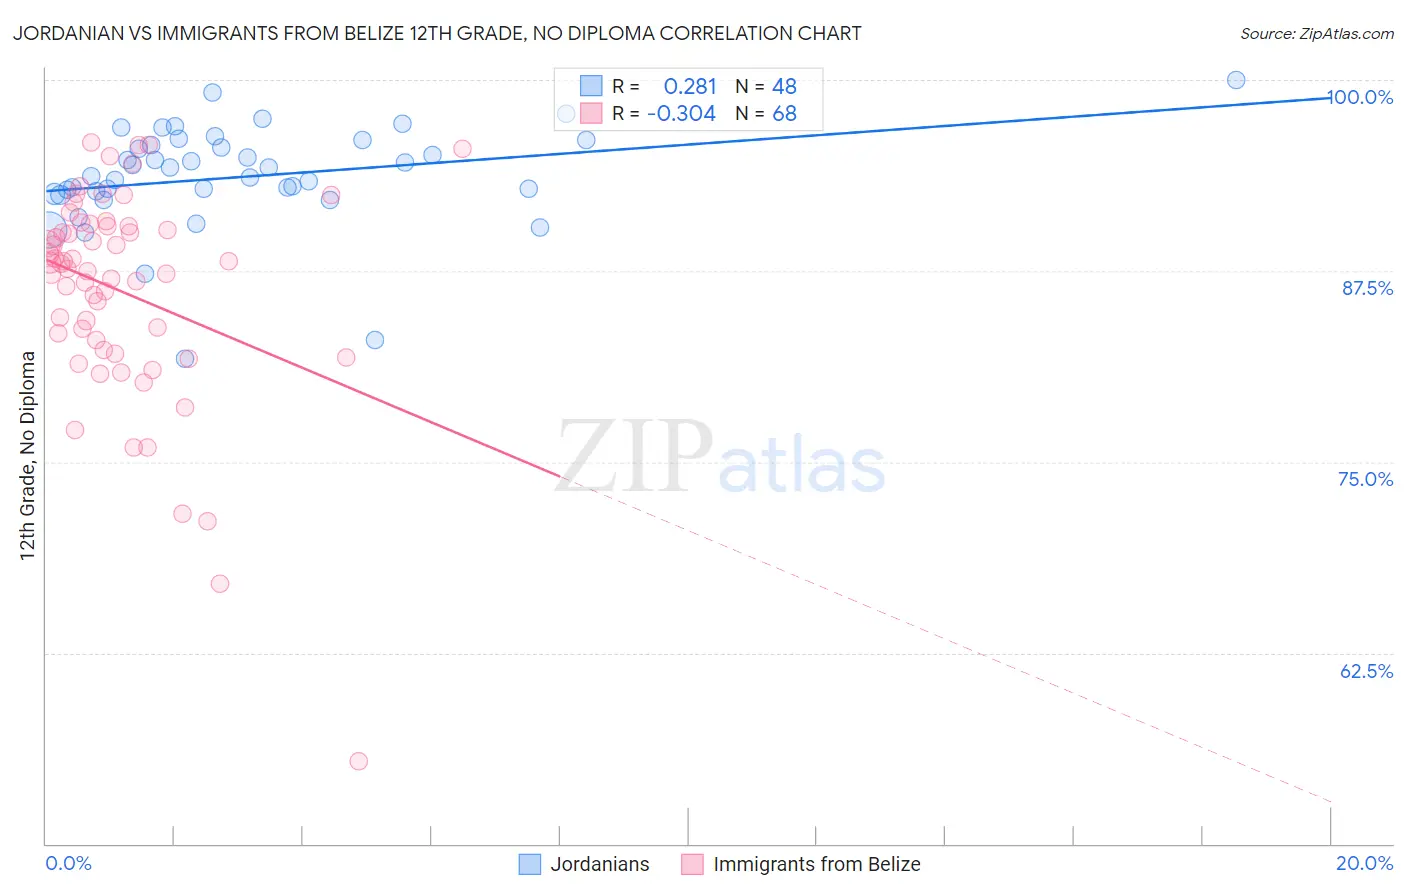
Jordanian vs Immigrants from Belize 12th Grade, No Diploma Correlation Chart
The statistical analysis conducted on geographies consisting of 166,403,553 people shows a weak positive correlation between the proportion of Jordanians and percentage of population with at least 12th grade (no diploma) education in the United States with a correlation coefficient (R) of 0.281 and weighted average of 92.2%. Similarly, the statistical analysis conducted on geographies consisting of 130,181,087 people shows a mild negative correlation between the proportion of Immigrants from Belize and percentage of population with at least 12th grade (no diploma) education in the United States with a correlation coefficient (R) of -0.304 and weighted average of 87.0%, a difference of 6.0%.
12th Grade, No Diploma Correlation Summary
| Measurement | Jordanian | Immigrants from Belize |
| Minimum | 81.8% | 55.4% |
| Maximum | 100.0% | 95.9% |
| Range | 18.2% | 40.5% |
| Mean | 93.7% | 86.1% |
| Median | 94.0% | 87.8% |
| Interquartile 25% (IQ1) | 92.6% | 82.6% |
| Interquartile 75% (IQ3) | 95.9% | 90.4% |
| Interquartile Range (IQR) | 3.3% | 7.8% |
| Standard Deviation (Sample) | 3.4% | 7.1% |
| Standard Deviation (Population) | 3.4% | 7.0% |
Similar Demographics by 12th Grade, No Diploma
Demographics Similar to Jordanians by 12th Grade, No Diploma
In terms of 12th grade, no diploma, the demographic groups most similar to Jordanians are Immigrants from Russia (92.2%, a difference of 0.010%), Syrian (92.2%, a difference of 0.010%), Immigrants from Hungary (92.1%, a difference of 0.020%), Palestinian (92.1%, a difference of 0.020%), and Immigrants from Belarus (92.2%, a difference of 0.030%).
| Demographics | Rating | Rank | 12th Grade, No Diploma |
| Swiss | 98.1 /100 | #101 | Exceptional 92.3% |
| Alaskan Athabascans | 98.1 /100 | #102 | Exceptional 92.3% |
| Immigrants | Norway | 98.1 /100 | #103 | Exceptional 92.3% |
| Lebanese | 97.6 /100 | #104 | Exceptional 92.2% |
| Immigrants | Belarus | 97.4 /100 | #105 | Exceptional 92.2% |
| Immigrants | Russia | 97.3 /100 | #106 | Exceptional 92.2% |
| Syrians | 97.2 /100 | #107 | Exceptional 92.2% |
| Jordanians | 97.2 /100 | #108 | Exceptional 92.2% |
| Immigrants | Hungary | 97.0 /100 | #109 | Exceptional 92.1% |
| Palestinians | 97.0 /100 | #110 | Exceptional 92.1% |
| Immigrants | Greece | 96.9 /100 | #111 | Exceptional 92.1% |
| Israelis | 96.8 /100 | #112 | Exceptional 92.1% |
| Immigrants | Zimbabwe | 96.5 /100 | #113 | Exceptional 92.1% |
| Yugoslavians | 96.5 /100 | #114 | Exceptional 92.1% |
| Immigrants | Sri Lanka | 96.4 /100 | #115 | Exceptional 92.1% |
Demographics Similar to Immigrants from Belize by 12th Grade, No Diploma
In terms of 12th grade, no diploma, the demographic groups most similar to Immigrants from Belize are Belizean (87.0%, a difference of 0.080%), Navajo (87.1%, a difference of 0.14%), Apache (87.3%, a difference of 0.43%), Nicaraguan (87.3%, a difference of 0.44%), and Immigrants from Nicaragua (86.6%, a difference of 0.46%).
| Demographics | Rating | Rank | 12th Grade, No Diploma |
| Immigrants | Ecuador | 0.0 /100 | #312 | Tragic 87.5% |
| Immigrants | Caribbean | 0.0 /100 | #313 | Tragic 87.4% |
| Cape Verdeans | 0.0 /100 | #314 | Tragic 87.4% |
| Nicaraguans | 0.0 /100 | #315 | Tragic 87.3% |
| Apache | 0.0 /100 | #316 | Tragic 87.3% |
| Navajo | 0.0 /100 | #317 | Tragic 87.1% |
| Belizeans | 0.0 /100 | #318 | Tragic 87.0% |
| Immigrants | Belize | 0.0 /100 | #319 | Tragic 87.0% |
| Immigrants | Nicaragua | 0.0 /100 | #320 | Tragic 86.6% |
| Puerto Ricans | 0.0 /100 | #321 | Tragic 86.5% |
| Central American Indians | 0.0 /100 | #322 | Tragic 86.5% |
| Yuman | 0.0 /100 | #323 | Tragic 86.5% |
| Immigrants | Cabo Verde | 0.0 /100 | #324 | Tragic 85.8% |
| Mexican American Indians | 0.0 /100 | #325 | Tragic 85.7% |
| Dominicans | 0.0 /100 | #326 | Tragic 85.7% |