Laotian vs Immigrants from Belize 12th Grade, No Diploma
COMPARE
Laotian
Immigrants from Belize
12th Grade, No Diploma
12th Grade, No Diploma Comparison
Laotians
Immigrants from Belize
91.3%
12TH GRADE, NO DIPLOMA
64.4/ 100
METRIC RATING
159th/ 347
METRIC RANK
87.0%
12TH GRADE, NO DIPLOMA
0.0/ 100
METRIC RATING
319th/ 347
METRIC RANK
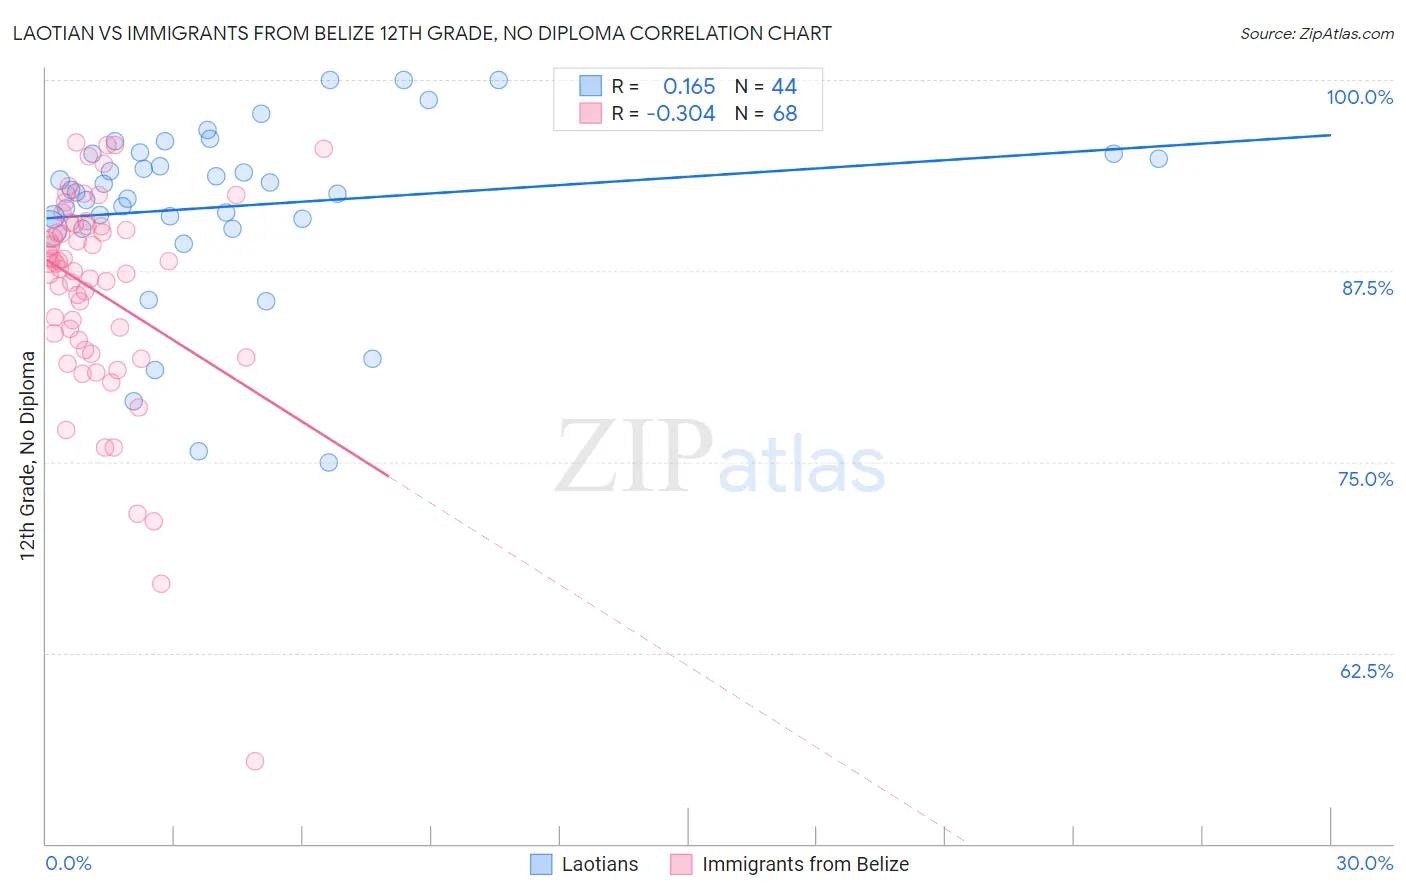
Laotian vs Immigrants from Belize 12th Grade, No Diploma Correlation Chart
The statistical analysis conducted on geographies consisting of 224,854,130 people shows a poor positive correlation between the proportion of Laotians and percentage of population with at least 12th grade (no diploma) education in the United States with a correlation coefficient (R) of 0.165 and weighted average of 91.3%. Similarly, the statistical analysis conducted on geographies consisting of 130,181,087 people shows a mild negative correlation between the proportion of Immigrants from Belize and percentage of population with at least 12th grade (no diploma) education in the United States with a correlation coefficient (R) of -0.304 and weighted average of 87.0%, a difference of 5.0%.
12th Grade, No Diploma Correlation Summary
| Measurement | Laotian | Immigrants from Belize |
| Minimum | 75.0% | 55.4% |
| Maximum | 100.0% | 95.9% |
| Range | 25.0% | 40.5% |
| Mean | 91.7% | 86.1% |
| Median | 92.7% | 87.8% |
| Interquartile 25% (IQ1) | 90.6% | 82.6% |
| Interquartile 75% (IQ3) | 95.2% | 90.4% |
| Interquartile Range (IQR) | 4.6% | 7.8% |
| Standard Deviation (Sample) | 5.8% | 7.1% |
| Standard Deviation (Population) | 5.8% | 7.0% |
Similar Demographics by 12th Grade, No Diploma
Demographics Similar to Laotians by 12th Grade, No Diploma
In terms of 12th grade, no diploma, the demographic groups most similar to Laotians are Immigrants from Albania (91.3%, a difference of 0.0%), Immigrants from Hong Kong (91.3%, a difference of 0.010%), Immigrants from Northern Africa (91.4%, a difference of 0.020%), Brazilian (91.3%, a difference of 0.030%), and Immigrants from Asia (91.3%, a difference of 0.040%).
| Demographics | Rating | Rank | 12th Grade, No Diploma |
| Kenyans | 77.4 /100 | #152 | Good 91.5% |
| Iraqis | 75.3 /100 | #153 | Good 91.5% |
| Immigrants | Kenya | 73.9 /100 | #154 | Good 91.5% |
| Immigrants | Iraq | 73.0 /100 | #155 | Good 91.4% |
| Asians | 71.9 /100 | #156 | Good 91.4% |
| Immigrants | Pakistan | 70.7 /100 | #157 | Good 91.4% |
| Immigrants | Northern Africa | 66.2 /100 | #158 | Good 91.4% |
| Laotians | 64.4 /100 | #159 | Good 91.3% |
| Immigrants | Albania | 64.1 /100 | #160 | Good 91.3% |
| Immigrants | Hong Kong | 63.8 /100 | #161 | Good 91.3% |
| Brazilians | 62.0 /100 | #162 | Good 91.3% |
| Immigrants | Asia | 61.5 /100 | #163 | Good 91.3% |
| Immigrants | China | 60.9 /100 | #164 | Good 91.3% |
| Alsatians | 58.3 /100 | #165 | Average 91.3% |
| Hmong | 58.0 /100 | #166 | Average 91.3% |
Demographics Similar to Immigrants from Belize by 12th Grade, No Diploma
In terms of 12th grade, no diploma, the demographic groups most similar to Immigrants from Belize are Belizean (87.0%, a difference of 0.080%), Navajo (87.1%, a difference of 0.14%), Apache (87.3%, a difference of 0.43%), Nicaraguan (87.3%, a difference of 0.44%), and Immigrants from Nicaragua (86.6%, a difference of 0.46%).
| Demographics | Rating | Rank | 12th Grade, No Diploma |
| Immigrants | Ecuador | 0.0 /100 | #312 | Tragic 87.5% |
| Immigrants | Caribbean | 0.0 /100 | #313 | Tragic 87.4% |
| Cape Verdeans | 0.0 /100 | #314 | Tragic 87.4% |
| Nicaraguans | 0.0 /100 | #315 | Tragic 87.3% |
| Apache | 0.0 /100 | #316 | Tragic 87.3% |
| Navajo | 0.0 /100 | #317 | Tragic 87.1% |
| Belizeans | 0.0 /100 | #318 | Tragic 87.0% |
| Immigrants | Belize | 0.0 /100 | #319 | Tragic 87.0% |
| Immigrants | Nicaragua | 0.0 /100 | #320 | Tragic 86.6% |
| Puerto Ricans | 0.0 /100 | #321 | Tragic 86.5% |
| Central American Indians | 0.0 /100 | #322 | Tragic 86.5% |
| Yuman | 0.0 /100 | #323 | Tragic 86.5% |
| Immigrants | Cabo Verde | 0.0 /100 | #324 | Tragic 85.8% |
| Mexican American Indians | 0.0 /100 | #325 | Tragic 85.7% |
| Dominicans | 0.0 /100 | #326 | Tragic 85.7% |