Guamanian/Chamorro vs Creek Married-couple Households
COMPARE
Guamanian/Chamorro
Creek
Married-couple Households
Married-couple Households Comparison
Guamanians/Chamorros
Creek
48.1%
MARRIED-COUPLE HOUSEHOLDS
97.6/ 100
METRIC RATING
83rd/ 347
METRIC RANK
45.3%
MARRIED-COUPLE HOUSEHOLDS
6.4/ 100
METRIC RATING
212th/ 347
METRIC RANK
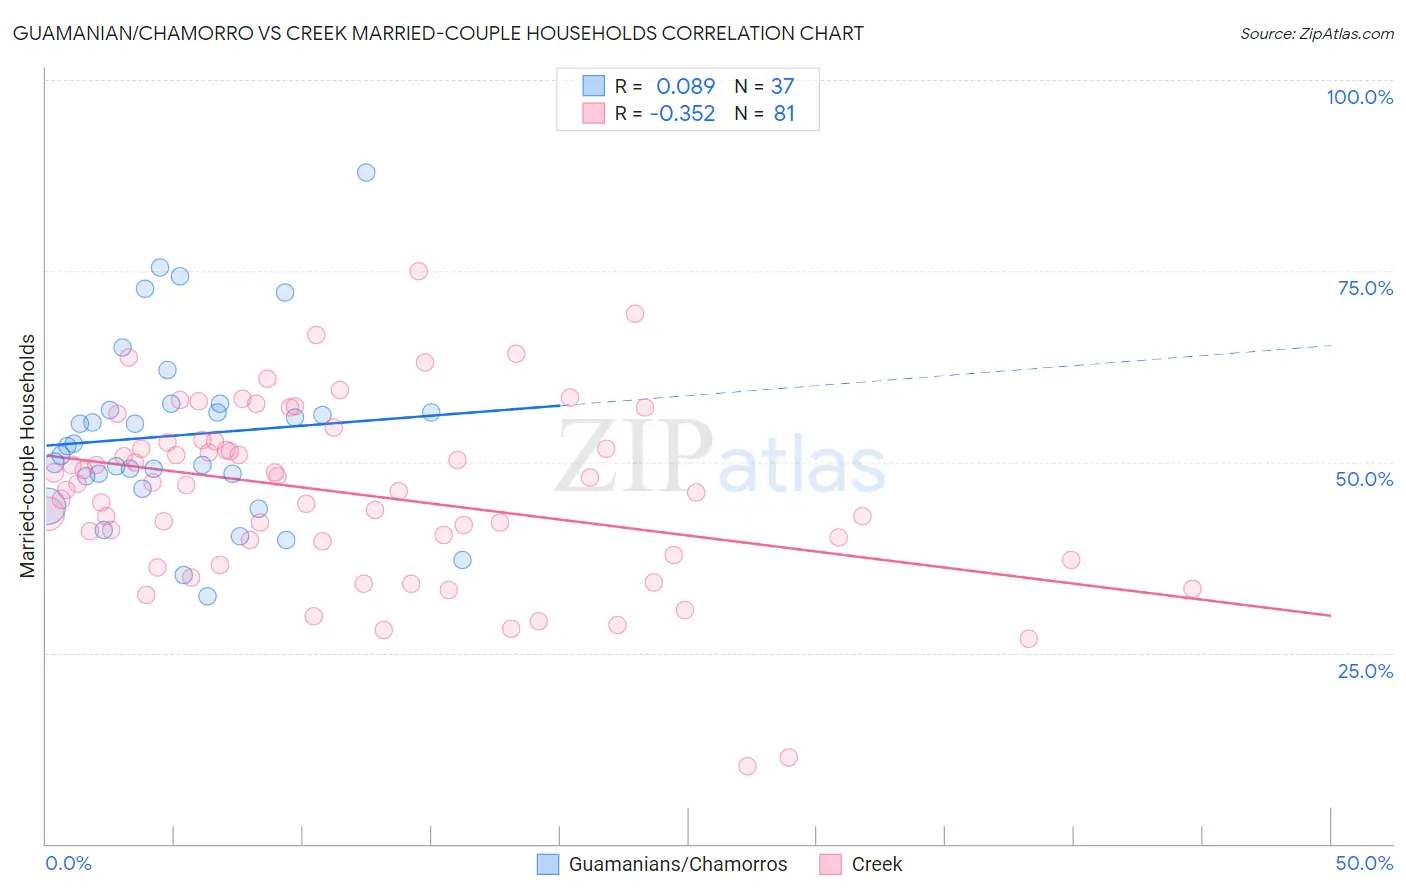
Guamanian/Chamorro vs Creek Married-couple Households Correlation Chart
The statistical analysis conducted on geographies consisting of 221,863,144 people shows a slight positive correlation between the proportion of Guamanians/Chamorros and percentage of married-couple family households in the United States with a correlation coefficient (R) of 0.089 and weighted average of 48.1%. Similarly, the statistical analysis conducted on geographies consisting of 178,433,601 people shows a mild negative correlation between the proportion of Creek and percentage of married-couple family households in the United States with a correlation coefficient (R) of -0.352 and weighted average of 45.3%, a difference of 6.2%.
Married-couple Households Correlation Summary
| Measurement | Guamanian/Chamorro | Creek |
| Minimum | 32.3% | 10.1% |
| Maximum | 87.9% | 75.0% |
| Range | 55.5% | 64.9% |
| Mean | 53.5% | 45.8% |
| Median | 52.1% | 47.0% |
| Interquartile 25% (IQ1) | 47.3% | 38.8% |
| Interquartile 75% (IQ3) | 57.2% | 52.6% |
| Interquartile Range (IQR) | 9.9% | 13.9% |
| Standard Deviation (Sample) | 11.9% | 11.8% |
| Standard Deviation (Population) | 11.7% | 11.7% |
Similar Demographics by Married-couple Households
Demographics Similar to Guamanians/Chamorros by Married-couple Households
In terms of married-couple households, the demographic groups most similar to Guamanians/Chamorros are Immigrants from Poland (48.1%, a difference of 0.020%), Ukrainian (48.1%, a difference of 0.020%), Immigrants from Israel (48.0%, a difference of 0.070%), Belgian (48.0%, a difference of 0.090%), and Immigrants from Ireland (48.0%, a difference of 0.11%).
| Demographics | Rating | Rank | Married-couple Households |
| Immigrants | Fiji | 98.4 /100 | #76 | Exceptional 48.2% |
| Canadians | 98.2 /100 | #77 | Exceptional 48.2% |
| Egyptians | 98.2 /100 | #78 | Exceptional 48.2% |
| Immigrants | Netherlands | 98.2 /100 | #79 | Exceptional 48.2% |
| Russians | 98.1 /100 | #80 | Exceptional 48.2% |
| Finns | 98.0 /100 | #81 | Exceptional 48.1% |
| Immigrants | Poland | 97.7 /100 | #82 | Exceptional 48.1% |
| Guamanians/Chamorros | 97.6 /100 | #83 | Exceptional 48.1% |
| Ukrainians | 97.6 /100 | #84 | Exceptional 48.1% |
| Immigrants | Israel | 97.4 /100 | #85 | Exceptional 48.0% |
| Belgians | 97.4 /100 | #86 | Exceptional 48.0% |
| Immigrants | Ireland | 97.3 /100 | #87 | Exceptional 48.0% |
| Afghans | 97.3 /100 | #88 | Exceptional 48.0% |
| Cypriots | 97.2 /100 | #89 | Exceptional 48.0% |
| French | 97.2 /100 | #90 | Exceptional 48.0% |
Demographics Similar to Creek by Married-couple Households
In terms of married-couple households, the demographic groups most similar to Creek are Yakama (45.2%, a difference of 0.10%), Immigrants from Spain (45.3%, a difference of 0.13%), Japanese (45.2%, a difference of 0.13%), Immigrants from Nepal (45.2%, a difference of 0.15%), and Immigrants from Portugal (45.2%, a difference of 0.15%).
| Demographics | Rating | Rank | Married-couple Households |
| Nepalese | 11.9 /100 | #205 | Poor 45.6% |
| Uruguayans | 10.4 /100 | #206 | Poor 45.5% |
| Immigrants | France | 8.8 /100 | #207 | Tragic 45.4% |
| Hispanics or Latinos | 8.7 /100 | #208 | Tragic 45.4% |
| Immigrants | Uzbekistan | 8.4 /100 | #209 | Tragic 45.4% |
| Cubans | 7.7 /100 | #210 | Tragic 45.4% |
| Immigrants | Spain | 7.3 /100 | #211 | Tragic 45.3% |
| Creek | 6.4 /100 | #212 | Tragic 45.3% |
| Yakama | 5.8 /100 | #213 | Tragic 45.2% |
| Japanese | 5.7 /100 | #214 | Tragic 45.2% |
| Immigrants | Nepal | 5.6 /100 | #215 | Tragic 45.2% |
| Immigrants | Portugal | 5.6 /100 | #216 | Tragic 45.2% |
| Panamanians | 5.5 /100 | #217 | Tragic 45.2% |
| Immigrants | Azores | 5.3 /100 | #218 | Tragic 45.2% |
| Nicaraguans | 5.3 /100 | #219 | Tragic 45.2% |