Ghanaian vs Immigrants from Zimbabwe 8th Grade
COMPARE
Ghanaian
Immigrants from Zimbabwe
8th Grade
8th Grade Comparison
Ghanaians
Immigrants from Zimbabwe
94.9%
8TH GRADE
0.6/ 100
METRIC RATING
259th/ 347
METRIC RANK
96.3%
8TH GRADE
96.7/ 100
METRIC RATING
113th/ 347
METRIC RANK
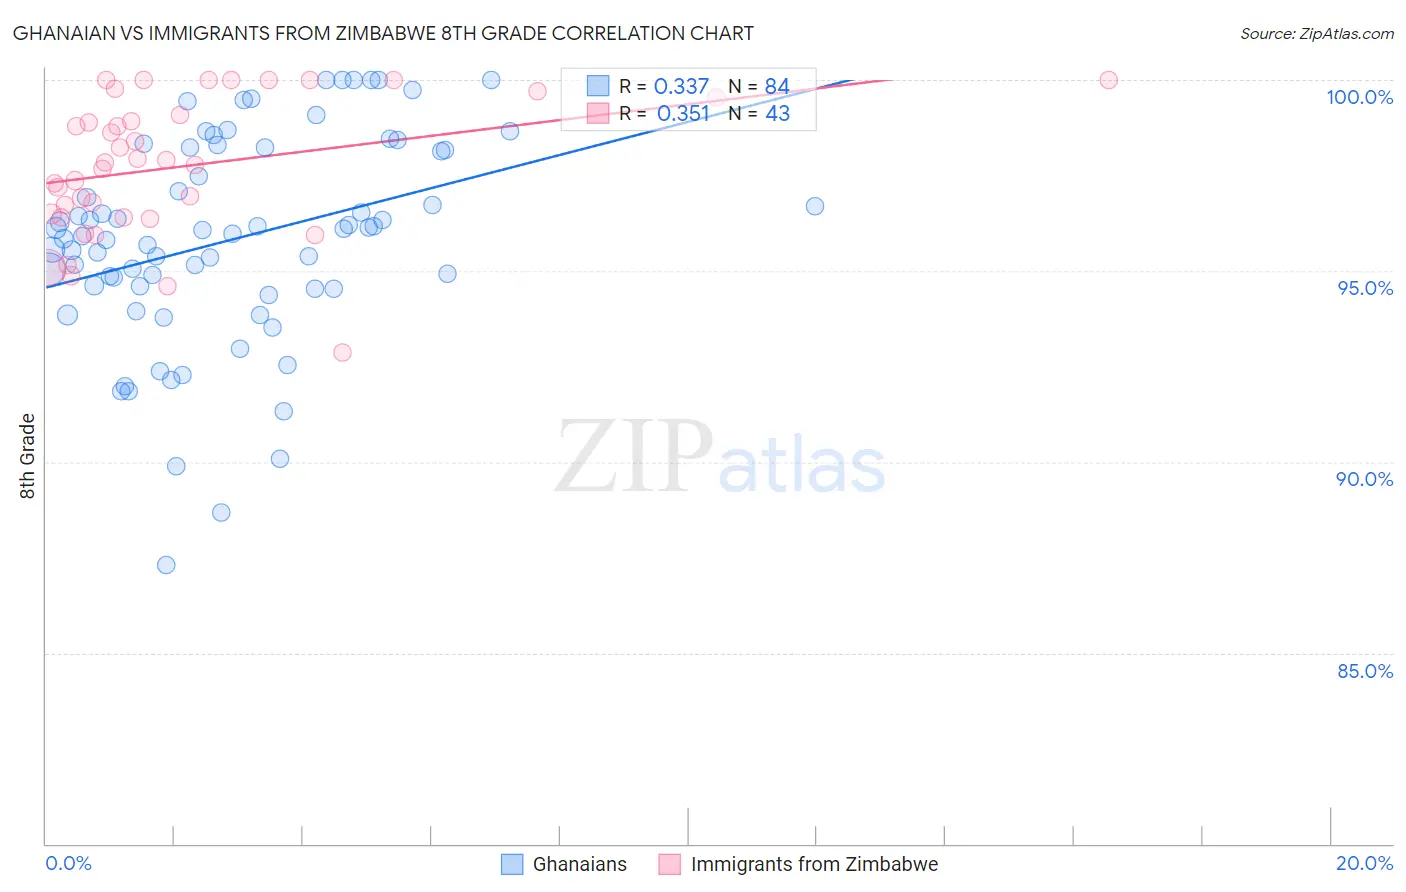
Ghanaian vs Immigrants from Zimbabwe 8th Grade Correlation Chart
The statistical analysis conducted on geographies consisting of 190,712,873 people shows a mild positive correlation between the proportion of Ghanaians and percentage of population with at least 8th grade education in the United States with a correlation coefficient (R) of 0.337 and weighted average of 94.9%. Similarly, the statistical analysis conducted on geographies consisting of 117,756,150 people shows a mild positive correlation between the proportion of Immigrants from Zimbabwe and percentage of population with at least 8th grade education in the United States with a correlation coefficient (R) of 0.351 and weighted average of 96.3%, a difference of 1.4%.
8th Grade Correlation Summary
| Measurement | Ghanaian | Immigrants from Zimbabwe |
| Minimum | 87.3% | 92.9% |
| Maximum | 100.0% | 100.0% |
| Range | 12.7% | 7.1% |
| Mean | 95.8% | 97.7% |
| Median | 96.0% | 97.8% |
| Interquartile 25% (IQ1) | 94.6% | 96.4% |
| Interquartile 75% (IQ3) | 98.2% | 99.5% |
| Interquartile Range (IQR) | 3.6% | 3.1% |
| Standard Deviation (Sample) | 2.7% | 1.8% |
| Standard Deviation (Population) | 2.7% | 1.8% |
Similar Demographics by 8th Grade
Demographics Similar to Ghanaians by 8th Grade
In terms of 8th grade, the demographic groups most similar to Ghanaians are Immigrants from Congo (94.9%, a difference of 0.0%), Immigrants from Jamaica (94.9%, a difference of 0.0%), Afghan (94.9%, a difference of 0.010%), Colombian (95.0%, a difference of 0.020%), and Immigrants from Somalia (95.0%, a difference of 0.030%).
| Demographics | Rating | Rank | 8th Grade |
| Immigrants | Ethiopia | 1.0 /100 | #252 | Tragic 95.0% |
| U.S. Virgin Islanders | 0.9 /100 | #253 | Tragic 95.0% |
| Immigrants | Cameroon | 0.8 /100 | #254 | Tragic 95.0% |
| Immigrants | Somalia | 0.7 /100 | #255 | Tragic 95.0% |
| Colombians | 0.7 /100 | #256 | Tragic 95.0% |
| Afghans | 0.6 /100 | #257 | Tragic 94.9% |
| Immigrants | Congo | 0.6 /100 | #258 | Tragic 94.9% |
| Ghanaians | 0.6 /100 | #259 | Tragic 94.9% |
| Immigrants | Jamaica | 0.6 /100 | #260 | Tragic 94.9% |
| Immigrants | Costa Rica | 0.5 /100 | #261 | Tragic 94.9% |
| Immigrants | Nigeria | 0.4 /100 | #262 | Tragic 94.9% |
| Immigrants | Hong Kong | 0.4 /100 | #263 | Tragic 94.9% |
| South Americans | 0.4 /100 | #264 | Tragic 94.9% |
| Yuman | 0.4 /100 | #265 | Tragic 94.9% |
| West Indians | 0.3 /100 | #266 | Tragic 94.8% |
Demographics Similar to Immigrants from Zimbabwe by 8th Grade
In terms of 8th grade, the demographic groups most similar to Immigrants from Zimbabwe are Syrian (96.3%, a difference of 0.0%), Shoshone (96.3%, a difference of 0.010%), Immigrants from Japan (96.2%, a difference of 0.010%), Immigrants from Moldova (96.2%, a difference of 0.010%), and Cajun (96.3%, a difference of 0.030%).
| Demographics | Rating | Rank | 8th Grade |
| Okinawans | 98.0 /100 | #106 | Exceptional 96.3% |
| Immigrants | Latvia | 97.8 /100 | #107 | Exceptional 96.3% |
| Lebanese | 97.5 /100 | #108 | Exceptional 96.3% |
| Iroquois | 97.5 /100 | #109 | Exceptional 96.3% |
| Cajuns | 97.1 /100 | #110 | Exceptional 96.3% |
| Shoshone | 96.8 /100 | #111 | Exceptional 96.3% |
| Syrians | 96.7 /100 | #112 | Exceptional 96.3% |
| Immigrants | Zimbabwe | 96.7 /100 | #113 | Exceptional 96.3% |
| Immigrants | Japan | 96.5 /100 | #114 | Exceptional 96.2% |
| Immigrants | Moldova | 96.5 /100 | #115 | Exceptional 96.2% |
| Immigrants | Nonimmigrants | 96.0 /100 | #116 | Exceptional 96.2% |
| Immigrants | Croatia | 96.0 /100 | #117 | Exceptional 96.2% |
| Immigrants | Norway | 95.7 /100 | #118 | Exceptional 96.2% |
| Immigrants | Switzerland | 95.3 /100 | #119 | Exceptional 96.2% |
| Immigrants | France | 95.3 /100 | #120 | Exceptional 96.2% |