Ghanaian vs Marshallese 8th Grade
COMPARE
Ghanaian
Marshallese
8th Grade
8th Grade Comparison
Ghanaians
Marshallese
94.9%
8TH GRADE
0.6/ 100
METRIC RATING
259th/ 347
METRIC RANK
95.7%
8TH GRADE
47.6/ 100
METRIC RATING
177th/ 347
METRIC RANK
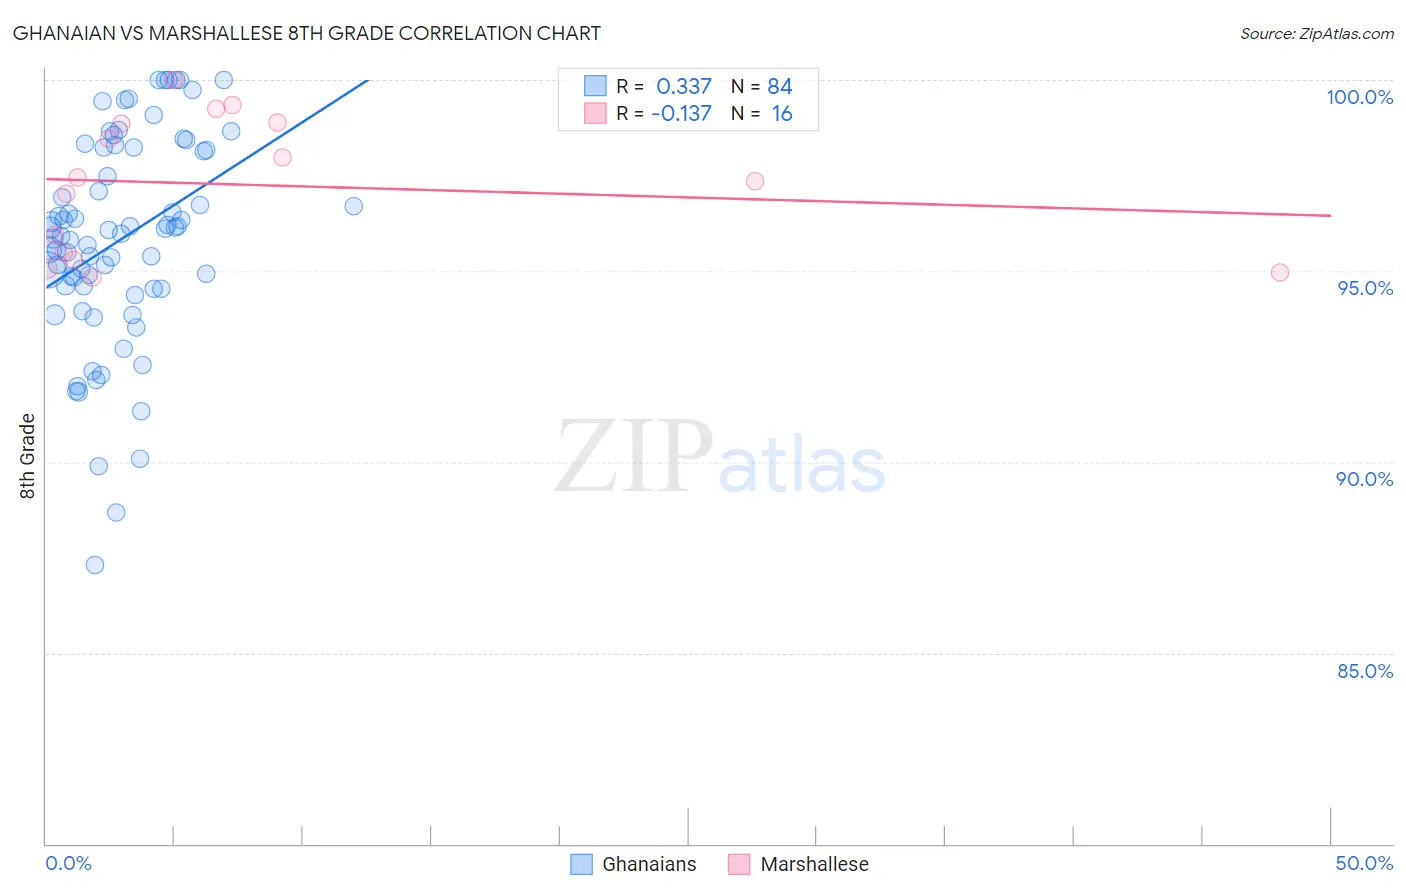
Ghanaian vs Marshallese 8th Grade Correlation Chart
The statistical analysis conducted on geographies consisting of 190,712,873 people shows a mild positive correlation between the proportion of Ghanaians and percentage of population with at least 8th grade education in the United States with a correlation coefficient (R) of 0.337 and weighted average of 94.9%. Similarly, the statistical analysis conducted on geographies consisting of 14,761,315 people shows a poor negative correlation between the proportion of Marshallese and percentage of population with at least 8th grade education in the United States with a correlation coefficient (R) of -0.137 and weighted average of 95.7%, a difference of 0.82%.
8th Grade Correlation Summary
| Measurement | Ghanaian | Marshallese |
| Minimum | 87.3% | 94.8% |
| Maximum | 100.0% | 100.0% |
| Range | 12.7% | 5.2% |
| Mean | 95.8% | 97.3% |
| Median | 96.0% | 97.4% |
| Interquartile 25% (IQ1) | 94.6% | 95.4% |
| Interquartile 75% (IQ3) | 98.2% | 98.9% |
| Interquartile Range (IQR) | 3.6% | 3.5% |
| Standard Deviation (Sample) | 2.7% | 1.8% |
| Standard Deviation (Population) | 2.7% | 1.7% |
Similar Demographics by 8th Grade
Demographics Similar to Ghanaians by 8th Grade
In terms of 8th grade, the demographic groups most similar to Ghanaians are Immigrants from Congo (94.9%, a difference of 0.0%), Immigrants from Jamaica (94.9%, a difference of 0.0%), Afghan (94.9%, a difference of 0.010%), Colombian (95.0%, a difference of 0.020%), and Immigrants from Somalia (95.0%, a difference of 0.030%).
| Demographics | Rating | Rank | 8th Grade |
| Immigrants | Ethiopia | 1.0 /100 | #252 | Tragic 95.0% |
| U.S. Virgin Islanders | 0.9 /100 | #253 | Tragic 95.0% |
| Immigrants | Cameroon | 0.8 /100 | #254 | Tragic 95.0% |
| Immigrants | Somalia | 0.7 /100 | #255 | Tragic 95.0% |
| Colombians | 0.7 /100 | #256 | Tragic 95.0% |
| Afghans | 0.6 /100 | #257 | Tragic 94.9% |
| Immigrants | Congo | 0.6 /100 | #258 | Tragic 94.9% |
| Ghanaians | 0.6 /100 | #259 | Tragic 94.9% |
| Immigrants | Jamaica | 0.6 /100 | #260 | Tragic 94.9% |
| Immigrants | Costa Rica | 0.5 /100 | #261 | Tragic 94.9% |
| Immigrants | Nigeria | 0.4 /100 | #262 | Tragic 94.9% |
| Immigrants | Hong Kong | 0.4 /100 | #263 | Tragic 94.9% |
| South Americans | 0.4 /100 | #264 | Tragic 94.9% |
| Yuman | 0.4 /100 | #265 | Tragic 94.9% |
| West Indians | 0.3 /100 | #266 | Tragic 94.8% |
Demographics Similar to Marshallese by 8th Grade
In terms of 8th grade, the demographic groups most similar to Marshallese are Venezuelan (95.7%, a difference of 0.0%), Immigrants from Albania (95.7%, a difference of 0.010%), Pakistani (95.7%, a difference of 0.010%), Immigrants from Brazil (95.7%, a difference of 0.010%), and Chilean (95.7%, a difference of 0.020%).
| Demographics | Rating | Rank | 8th Grade |
| Ute | 58.5 /100 | #170 | Average 95.8% |
| Egyptians | 58.2 /100 | #171 | Average 95.8% |
| Immigrants | Korea | 57.9 /100 | #172 | Average 95.8% |
| Mongolians | 53.0 /100 | #173 | Average 95.8% |
| Chileans | 50.0 /100 | #174 | Average 95.7% |
| Immigrants | Albania | 49.6 /100 | #175 | Average 95.7% |
| Pakistanis | 48.8 /100 | #176 | Average 95.7% |
| Marshallese | 47.6 /100 | #177 | Average 95.7% |
| Venezuelans | 47.5 /100 | #178 | Average 95.7% |
| Immigrants | Brazil | 45.4 /100 | #179 | Average 95.7% |
| Iraqis | 40.5 /100 | #180 | Average 95.7% |
| Immigrants | Spain | 38.7 /100 | #181 | Fair 95.7% |
| Immigrants | Egypt | 37.9 /100 | #182 | Fair 95.7% |
| Immigrants | Iraq | 36.2 /100 | #183 | Fair 95.6% |
| Immigrants | Uganda | 36.0 /100 | #184 | Fair 95.6% |