Nepalese vs Soviet Union 8th Grade
COMPARE
Nepalese
Soviet Union
8th Grade
8th Grade Comparison
Nepalese
Soviet Union
92.8%
8TH GRADE
0.0/ 100
METRIC RATING
324th/ 347
METRIC RANK
96.1%
8TH GRADE
92.6/ 100
METRIC RATING
130th/ 347
METRIC RANK
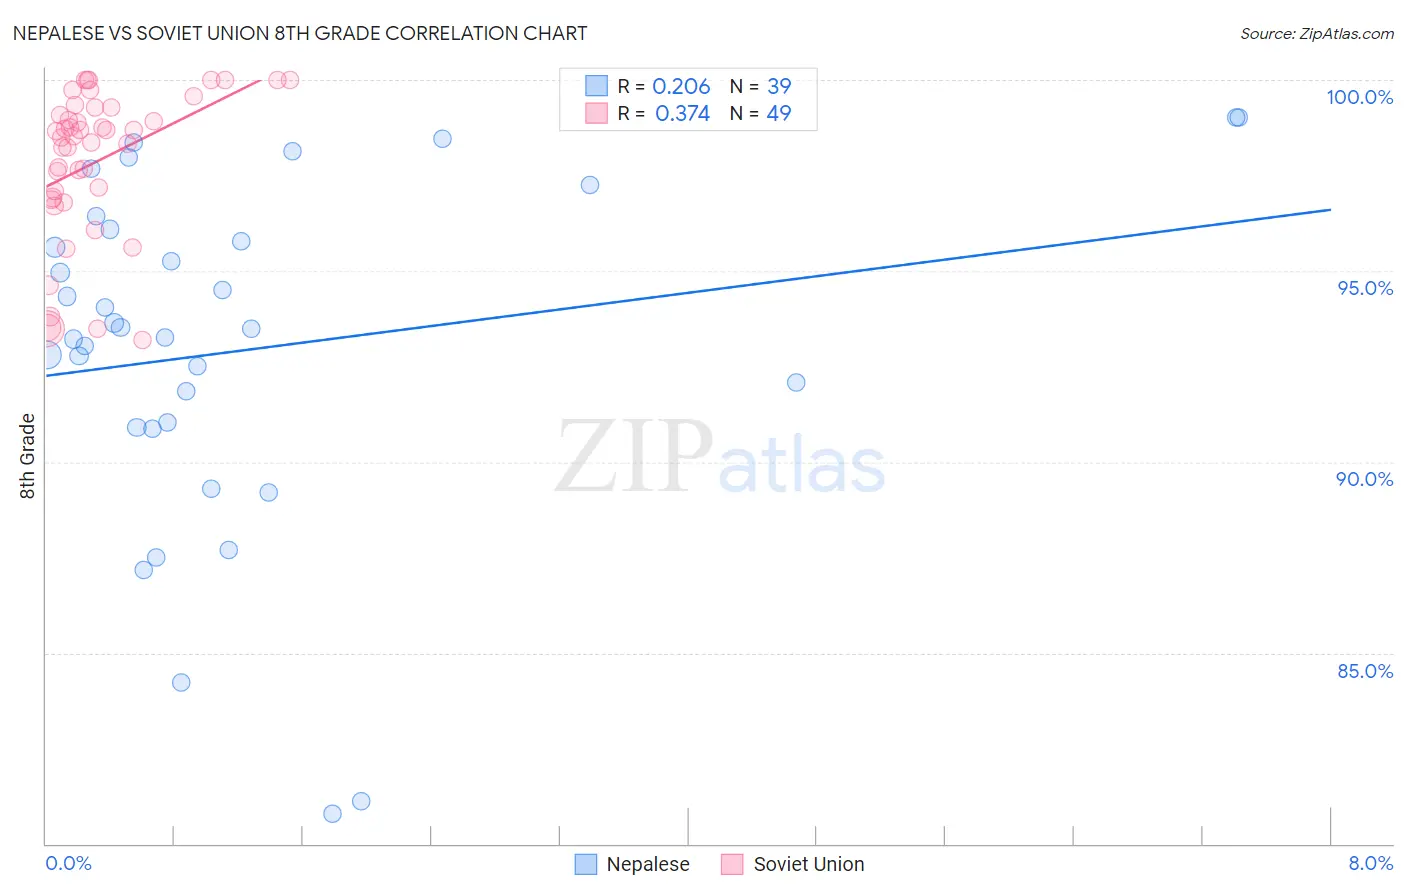
Nepalese vs Soviet Union 8th Grade Correlation Chart
The statistical analysis conducted on geographies consisting of 24,519,269 people shows a weak positive correlation between the proportion of Nepalese and percentage of population with at least 8th grade education in the United States with a correlation coefficient (R) of 0.206 and weighted average of 92.8%. Similarly, the statistical analysis conducted on geographies consisting of 43,454,395 people shows a mild positive correlation between the proportion of Soviet Union and percentage of population with at least 8th grade education in the United States with a correlation coefficient (R) of 0.374 and weighted average of 96.1%, a difference of 3.5%.
8th Grade Correlation Summary
| Measurement | Nepalese | Soviet Union |
| Minimum | 80.8% | 93.2% |
| Maximum | 99.0% | 100.0% |
| Range | 18.2% | 6.8% |
| Mean | 92.9% | 97.9% |
| Median | 93.5% | 98.5% |
| Interquartile 25% (IQ1) | 90.9% | 96.9% |
| Interquartile 75% (IQ3) | 96.1% | 99.3% |
| Interquartile Range (IQR) | 5.2% | 2.4% |
| Standard Deviation (Sample) | 4.5% | 2.0% |
| Standard Deviation (Population) | 4.5% | 1.9% |
Similar Demographics by 8th Grade
Demographics Similar to Nepalese by 8th Grade
In terms of 8th grade, the demographic groups most similar to Nepalese are Immigrants from Belize (92.9%, a difference of 0.070%), Dominican (92.8%, a difference of 0.090%), Nicaraguan (93.0%, a difference of 0.12%), Central American Indian (92.7%, a difference of 0.14%), and Belizean (93.1%, a difference of 0.24%).
| Demographics | Rating | Rank | 8th Grade |
| Immigrants | Ecuador | 0.0 /100 | #317 | Tragic 93.3% |
| Puerto Ricans | 0.0 /100 | #318 | Tragic 93.2% |
| Immigrants | Cuba | 0.0 /100 | #319 | Tragic 93.2% |
| Immigrants | Fiji | 0.0 /100 | #320 | Tragic 93.2% |
| Belizeans | 0.0 /100 | #321 | Tragic 93.1% |
| Nicaraguans | 0.0 /100 | #322 | Tragic 93.0% |
| Immigrants | Belize | 0.0 /100 | #323 | Tragic 92.9% |
| Nepalese | 0.0 /100 | #324 | Tragic 92.8% |
| Dominicans | 0.0 /100 | #325 | Tragic 92.8% |
| Central American Indians | 0.0 /100 | #326 | Tragic 92.7% |
| Immigrants | Azores | 0.0 /100 | #327 | Tragic 92.5% |
| Immigrants | Nicaragua | 0.0 /100 | #328 | Tragic 92.5% |
| Immigrants | Cabo Verde | 0.0 /100 | #329 | Tragic 92.4% |
| Immigrants | Armenia | 0.0 /100 | #330 | Tragic 92.3% |
| Hondurans | 0.0 /100 | #331 | Tragic 92.3% |
Demographics Similar to Soviet Union by 8th Grade
In terms of 8th grade, the demographic groups most similar to Soviet Union are Pueblo (96.1%, a difference of 0.010%), Immigrants from Kuwait (96.1%, a difference of 0.010%), Cheyenne (96.1%, a difference of 0.020%), Immigrants from Turkey (96.1%, a difference of 0.020%), and Immigrants from Hungary (96.1%, a difference of 0.020%).
| Demographics | Rating | Rank | 8th Grade |
| Filipinos | 94.6 /100 | #123 | Exceptional 96.2% |
| Palestinians | 94.6 /100 | #124 | Exceptional 96.2% |
| Immigrants | Romania | 94.1 /100 | #125 | Exceptional 96.2% |
| Choctaw | 94.0 /100 | #126 | Exceptional 96.2% |
| Immigrants | Serbia | 94.0 /100 | #127 | Exceptional 96.2% |
| Immigrants | Bosnia and Herzegovina | 93.9 /100 | #128 | Exceptional 96.2% |
| Cheyenne | 93.3 /100 | #129 | Exceptional 96.1% |
| Soviet Union | 92.6 /100 | #130 | Exceptional 96.1% |
| Pueblo | 92.3 /100 | #131 | Exceptional 96.1% |
| Immigrants | Kuwait | 92.2 /100 | #132 | Exceptional 96.1% |
| Immigrants | Turkey | 91.7 /100 | #133 | Exceptional 96.1% |
| Immigrants | Hungary | 91.5 /100 | #134 | Exceptional 96.1% |
| Basques | 91.5 /100 | #135 | Exceptional 96.1% |
| Jordanians | 91.3 /100 | #136 | Exceptional 96.1% |
| Cambodians | 90.6 /100 | #137 | Exceptional 96.1% |