Hopi vs Soviet Union 8th Grade

COMPARE

Hopi
Race
Ancestry
AfghanAfricanAlaska NativeAlaskan AthabascanAlbanianAleutAlsatianAmericanApacheArabArapahoArgentineanArmenianAssyrian/Chaldean/SyriacAustralianAustrianBahamianBangladeshiBarbadianBasqueBelgianBelizeanBermudanBhutaneseBlackfeetBolivianBrazilianBritishBritish West IndianBulgarianBurmeseCajunCambodianCanadianCape VerdeanCarpatho RusynCelticCentral AmericanCentral American IndianCherokeeCheyenneChickasawChileanChineseChippewaChoctawColombianColvilleComancheCosta RicanCreeCreekCroatianCrowCubanCypriotCzechCzechoslovakianDanishDelawareDominicanDutchDutch West IndianEastern EuropeanEcuadorianEgyptianEnglishEstonianEthiopianEuropeanFijianFilipinoFinnishFrenchFrench American IndianFrench CanadianGermanGerman RussianGhanaianGreekGuamanian/ChamorroGuatemalanGuyaneseHaitianHmongHonduranHopiHoumaHungarianIcelanderIndian (Asian)IndonesianInupiatIranianIraqiIrishIroquoisIsraeliItalianJamaicanJapaneseJordanianKenyanKiowaKoreanLaotianLatvianLebaneseLiberianLithuanianLumbeeLuxembourgerMacedonianMalaysianMalteseMarshalleseMenomineeMexicanMexican American IndianMongolianMoroccanNative HawaiianNavajoNepaleseNew ZealanderNicaraguanNigerianNorthern EuropeanNorwegianOkinawanOsageOttawaPaiutePakistaniPalestinianPanamanianParaguayanPennsylvania GermanPeruvianPimaPolishPortuguesePotawatomiPuebloPuerto RicanPuget Sound SalishRomanianRussianSalvadoranSamoanScandinavianScotch-IrishScottishSeminoleSenegaleseSerbianShoshoneSierra LeoneanSiouxSlavicSlovakSloveneSomaliSouth AfricanSouth AmericanSouth American IndianSpaniardSpanishSpanish AmericanSpanish American IndianSri LankanSubsaharan AfricanSudaneseSwedishSwissSyrianTaiwaneseThaiTlingit-HaidaTohono O'OdhamTonganTrinidadian and TobagonianTsimshianTurkishU.S. Virgin IslanderUgandanUkrainianUruguayanUteVenezuelanVietnameseWelshWest IndianYakamaYaquiYugoslavianYumanYup'ikZimbabwean
Immigration
NonimmigrantsImmigrantsAfghanistanAfricaAlbaniaArgentinaArmeniaAsiaAustraliaAustriaBahamasBangladeshBarbadosBelarusBelgiumBelizeBoliviaBosnia and HerzegovinaBrazilBulgariaBurma/MyanmarCabo VerdeCambodiaCameroonCanadaCaribbeanCentral AmericaChileChinaColombiaCongoCosta RicaCroatiaCubaCzechoslovakiaDenmarkDominicaDominican RepublicEastern AfricaEastern AsiaEastern EuropeEcuadorEgyptEl SalvadorEnglandEritreaEthiopiaEuropeFijiFranceGermanyGhanaGreeceGrenadaGuatemalaGuyanaHaitiHondurasHong KongHungaryIndiaIndonesiaIranIraqIrelandIsraelItalyJamaicaJapanJordanKazakhstanKenyaKoreaKuwaitLaosLatin AmericaLatviaLebanonLiberiaLithuaniaMalaysiaMexicoMicronesiaMiddle AfricaMoldovaMoroccoNepalNetherlandsNicaraguaNigeriaNorth AmericaNorth MacedoniaNorthern AfricaNorthern EuropeNorwayOceaniaPakistanPanamaPeruPhilippinesPolandPortugalRomaniaRussiaSaudi ArabiaScotlandSenegalSerbiaSierra LeoneSingaporeSomaliaSouth AfricaSouth AmericaSouth Central AsiaSouth Eastern AsiaSouthern EuropeSpainSri LankaSt. Vincent and the GrenadinesSudanSwedenSwitzerlandSyriaTaiwanThailandTrinidad and TobagoTurkeyUgandaUkraineUruguayUzbekistanVenezuelaVietnamWest IndiesWestern AfricaWestern AsiaWestern EuropeYemenZaireZimbabweAzores
Soviet Union
Race
Ancestry
AfghanAfricanAlaska NativeAlaskan AthabascanAlbanianAleutAlsatianAmericanApacheArabArapahoArgentineanArmenianAssyrian/Chaldean/SyriacAustralianAustrianBahamianBangladeshiBarbadianBasqueBelgianBelizeanBermudanBhutaneseBlackfeetBolivianBrazilianBritishBritish West IndianBulgarianBurmeseCajunCambodianCanadianCape VerdeanCarpatho RusynCelticCentral AmericanCentral American IndianCherokeeCheyenneChickasawChileanChineseChippewaChoctawColombianColvilleComancheCosta RicanCreeCreekCroatianCrowCubanCypriotCzechCzechoslovakianDanishDelawareDominicanDutchDutch West IndianEastern EuropeanEcuadorianEgyptianEnglishEstonianEthiopianEuropeanFijianFilipinoFinnishFrenchFrench American IndianFrench CanadianGermanGerman RussianGhanaianGreekGuamanian/ChamorroGuatemalanGuyaneseHaitianHmongHonduranHoumaHungarianIcelanderIndian (Asian)IndonesianInupiatIranianIraqiIrishIroquoisIsraeliItalianJamaicanJapaneseJordanianKenyanKiowaKoreanLaotianLatvianLebaneseLiberianLithuanianLumbeeLuxembourgerMacedonianMalaysianMalteseMarshalleseMenomineeMexicanMexican American IndianMongolianMoroccanNative HawaiianNavajoNepaleseNew ZealanderNicaraguanNigerianNorthern EuropeanNorwegianOkinawanOsageOttawaPaiutePakistaniPalestinianPanamanianParaguayanPennsylvania GermanPeruvianPimaPolishPortuguesePotawatomiPuebloPuerto RicanPuget Sound SalishRomanianRussianSalvadoranSamoanScandinavianScotch-IrishScottishSeminoleSenegaleseSerbianShoshoneSierra LeoneanSiouxSlavicSlovakSloveneSomaliSouth AfricanSouth AmericanSouth American IndianSoviet UnionSpaniardSpanishSpanish AmericanSpanish American IndianSri LankanSubsaharan AfricanSudaneseSwedishSwissSyrianTaiwaneseThaiTlingit-HaidaTohono O'OdhamTonganTrinidadian and TobagonianTsimshianTurkishU.S. Virgin IslanderUgandanUkrainianUruguayanUteVenezuelanVietnameseWelshWest IndianYakamaYaquiYugoslavianYumanYup'ikZimbabwean
Immigration
NonimmigrantsImmigrantsAfghanistanAfricaAlbaniaArgentinaArmeniaAsiaAustraliaAustriaBahamasBangladeshBarbadosBelarusBelgiumBelizeBoliviaBosnia and HerzegovinaBrazilBulgariaBurma/MyanmarCabo VerdeCambodiaCameroonCanadaCaribbeanCentral AmericaChileChinaColombiaCongoCosta RicaCroatiaCubaCzechoslovakiaDenmarkDominicaDominican RepublicEastern AfricaEastern AsiaEastern EuropeEcuadorEgyptEl SalvadorEnglandEritreaEthiopiaEuropeFijiFranceGermanyGhanaGreeceGrenadaGuatemalaGuyanaHaitiHondurasHong KongHungaryIndiaIndonesiaIranIraqIrelandIsraelItalyJamaicaJapanJordanKazakhstanKenyaKoreaKuwaitLaosLatin AmericaLatviaLebanonLiberiaLithuaniaMalaysiaMexicoMicronesiaMiddle AfricaMoldovaMoroccoNepalNetherlandsNicaraguaNigeriaNorth AmericaNorth MacedoniaNorthern AfricaNorthern EuropeNorwayOceaniaPakistanPanamaPeruPhilippinesPolandPortugalRomaniaRussiaSaudi ArabiaScotlandSenegalSerbiaSierra LeoneSingaporeSomaliaSouth AfricaSouth AmericaSouth Central AsiaSouth Eastern AsiaSouthern EuropeSpainSri LankaSt. Vincent and the GrenadinesSudanSwedenSwitzerlandSyriaTaiwanThailandTrinidad and TobagoTurkeyUgandaUkraineUruguayUzbekistanVenezuelaVietnamWest IndiesWestern AfricaWestern AsiaWestern EuropeYemenZaireZimbabweAzores
8th Grade
Income
Poverty
Unemployment
Labor Participation
Family Structure
Vehicle Availability
Education Level
Disability

8th Grade Comparison

Hopi

Soviet Union

Good
Exceptional
95.9%
8TH GRADE
79.4/ 100
METRIC RATING
154th/ 347
METRIC RANK
96.1%
8TH GRADE
92.6/ 100
METRIC RATING
130th/ 347
METRIC RANK

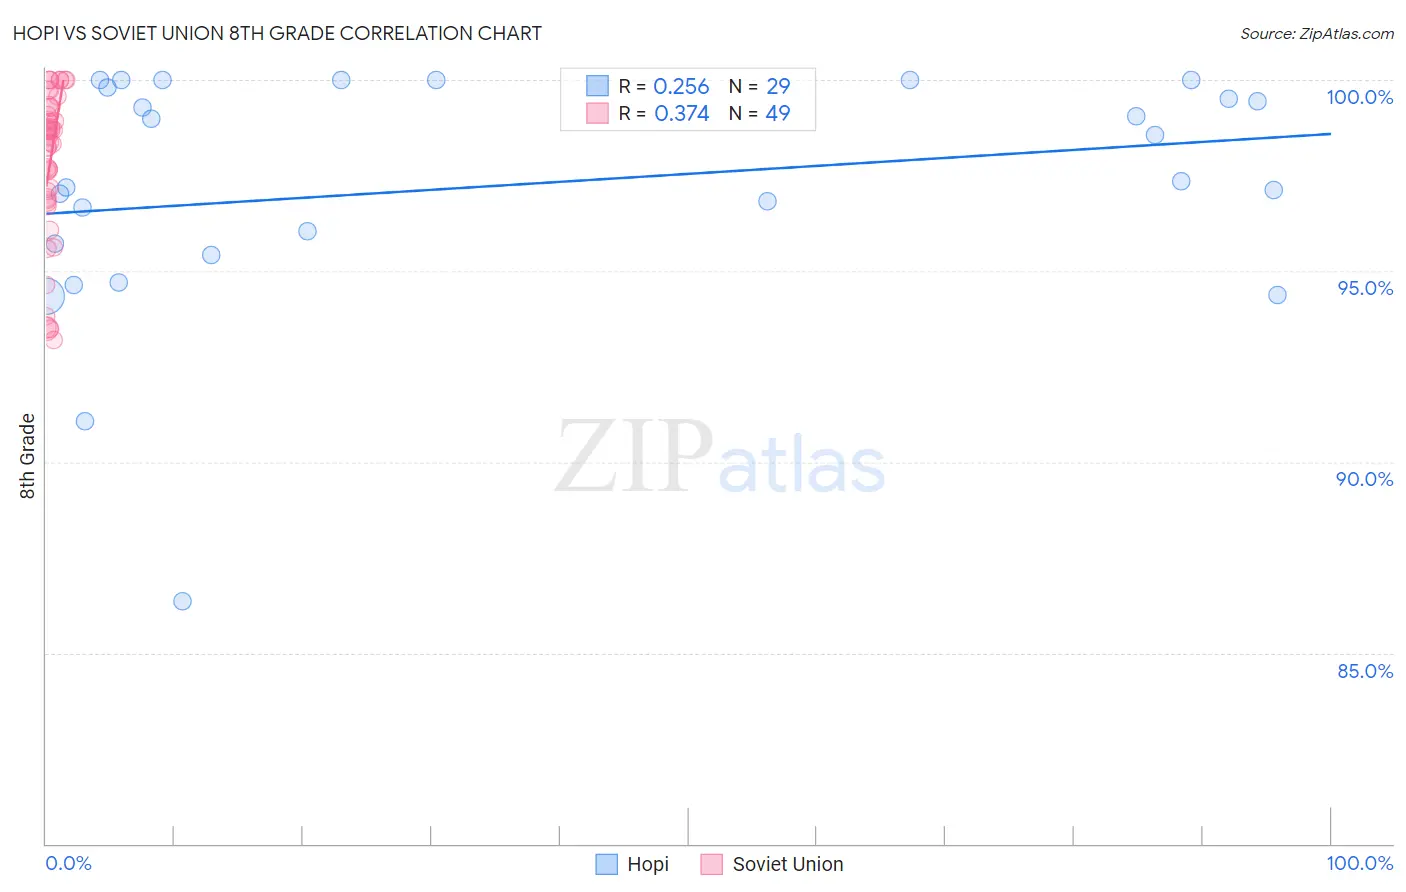
Hopi vs Soviet Union 8th Grade Correlation Chart

The statistical analysis conducted on geographies consisting of 74,739,957 people shows a weak positive correlation between the proportion of Hopi and percentage of population with at least 8th grade education in the United States with a correlation coefficient (R) of 0.256 and weighted average of 95.9%. Similarly, the statistical analysis conducted on geographies consisting of 43,454,395 people shows a mild positive correlation between the proportion of Soviet Union and percentage of population with at least 8th grade education in the United States with a correlation coefficient (R) of 0.374 and weighted average of 96.1%, a difference of 0.19%.
Hopi vs Soviet Union 8th Grade

8th Grade Correlation Summary

MeasurementHopiSoviet Union
Minimum86.4%93.2%
Maximum100.0%100.0%
Range13.6%6.8%
Mean97.2%97.9%
Median97.4%98.5%
Interquartile 25% (IQ1)95.6%96.9%
Interquartile 75% (IQ3)99.9%99.3%
Interquartile Range (IQR)4.3%2.4%
Standard Deviation (Sample)3.1%2.0%
Standard Deviation (Population)3.1%1.9%

Similar Demographics by 8th Grade

Demographics Similar to Hopi by 8th Grade

In terms of 8th grade, the demographic groups most similar to Hopi are Immigrants from Jordan (95.9%, a difference of 0.0%), Blackfeet (96.0%, a difference of 0.010%), French American Indian (96.0%, a difference of 0.010%), Immigrants from Israel (96.0%, a difference of 0.020%), and Immigrants from Russia (96.0%, a difference of 0.020%).
DemographicsRating | Rank8th Grade
Colville
84.0
/100
|
#147
Excellent
96.0%
Albanians
83.1
/100
|
#148
Excellent
96.0%
Immigrants | Israel
81.3
/100
|
#149
Excellent
96.0%
Immigrants | Russia
80.9
/100
|
#150
Excellent
96.0%
Blackfeet
80.8
/100
|
#151
Excellent
96.0%
French American Indians
80.6
/100
|
#152
Excellent
96.0%
Immigrants | Jordan
79.5
/100
|
#153
Good
95.9%
Hopi
79.4
/100
|
#154
Good
95.9%
Kenyans
74.5
/100
|
#155
Good
95.9%
Ugandans
74.1
/100
|
#156
Good
95.9%
Immigrants | Taiwan
70.5
/100
|
#157
Good
95.9%
Arabs
69.4
/100
|
#158
Good
95.9%
Immigrants | Kazakhstan
68.4
/100
|
#159
Good
95.9%
Seminole
67.7
/100
|
#160
Good
95.8%
Bermudans
67.5
/100
|
#161
Good
95.8%

Demographics Similar to Soviet Union by 8th Grade

In terms of 8th grade, the demographic groups most similar to Soviet Union are Pueblo (96.1%, a difference of 0.010%), Immigrants from Kuwait (96.1%, a difference of 0.010%), Cheyenne (96.1%, a difference of 0.020%), Immigrants from Turkey (96.1%, a difference of 0.020%), and Immigrants from Hungary (96.1%, a difference of 0.020%).
DemographicsRating | Rank8th Grade
Filipinos
94.6
/100
|
#123
Exceptional
96.2%
Palestinians
94.6
/100
|
#124
Exceptional
96.2%
Immigrants | Romania
94.1
/100
|
#125
Exceptional
96.2%
Choctaw
94.0
/100
|
#126
Exceptional
96.2%
Immigrants | Serbia
94.0
/100
|
#127
Exceptional
96.2%
Immigrants | Bosnia and Herzegovina
93.9
/100
|
#128
Exceptional
96.2%
Cheyenne
93.3
/100
|
#129
Exceptional
96.1%
Soviet Union
92.6
/100
|
#130
Exceptional
96.1%
Pueblo
92.3
/100
|
#131
Exceptional
96.1%
Immigrants | Kuwait
92.2
/100
|
#132
Exceptional
96.1%
Immigrants | Turkey
91.7
/100
|
#133
Exceptional
96.1%
Immigrants | Hungary
91.5
/100
|
#134
Exceptional
96.1%
Basques
91.5
/100
|
#135
Exceptional
96.1%
Jordanians
91.3
/100
|
#136
Exceptional
96.1%
Cambodians
90.6
/100
|
#137
Exceptional
96.1%