Ghanaian vs Yugoslavian College, 1 year or more
COMPARE
Ghanaian
Yugoslavian
College, 1 year or more
College, 1 year or more Comparison
Ghanaians
Yugoslavians
58.4%
COLLEGE, 1 YEAR OR MORE
20.9/ 100
METRIC RATING
203rd/ 347
METRIC RANK
59.2%
COLLEGE, 1 YEAR OR MORE
44.1/ 100
METRIC RATING
180th/ 347
METRIC RANK
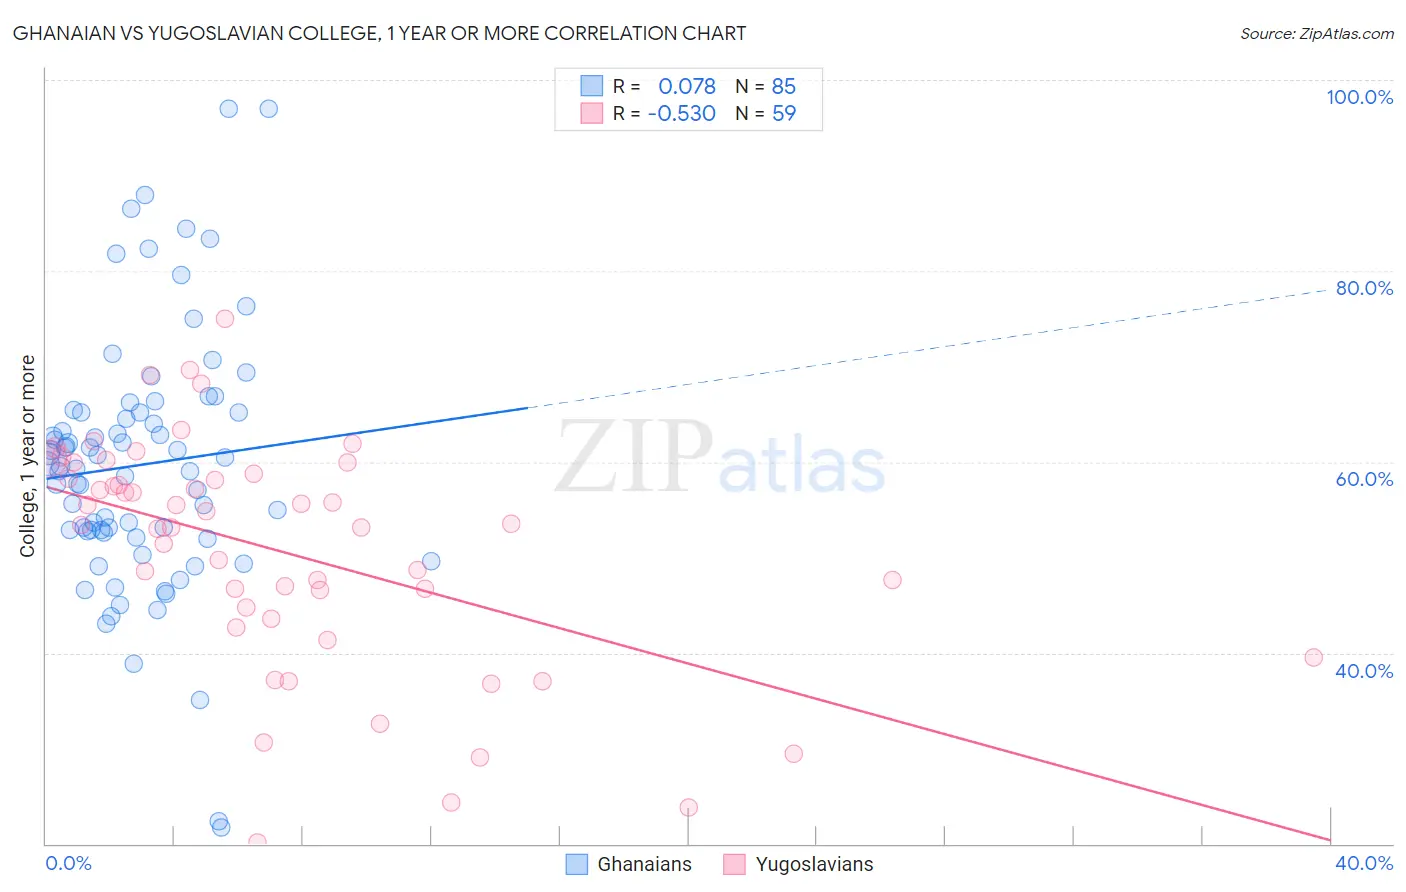
Ghanaian vs Yugoslavian College, 1 year or more Correlation Chart
The statistical analysis conducted on geographies consisting of 190,712,650 people shows a slight positive correlation between the proportion of Ghanaians and percentage of population with at least college, 1 year or more education in the United States with a correlation coefficient (R) of 0.078 and weighted average of 58.4%. Similarly, the statistical analysis conducted on geographies consisting of 285,723,201 people shows a substantial negative correlation between the proportion of Yugoslavians and percentage of population with at least college, 1 year or more education in the United States with a correlation coefficient (R) of -0.530 and weighted average of 59.2%, a difference of 1.5%.
College, 1 year or more Correlation Summary
| Measurement | Ghanaian | Yugoslavian |
| Minimum | 21.7% | 20.1% |
| Maximum | 97.0% | 75.0% |
| Range | 75.4% | 54.9% |
| Mean | 59.7% | 50.6% |
| Median | 59.6% | 53.3% |
| Interquartile 25% (IQ1) | 52.7% | 43.6% |
| Interquartile 75% (IQ3) | 65.2% | 58.8% |
| Interquartile Range (IQR) | 12.5% | 15.2% |
| Standard Deviation (Sample) | 13.4% | 12.1% |
| Standard Deviation (Population) | 13.4% | 12.0% |
Similar Demographics by College, 1 year or more
Demographics Similar to Ghanaians by College, 1 year or more
In terms of college, 1 year or more, the demographic groups most similar to Ghanaians are Immigrants from South America (58.4%, a difference of 0.090%), Panamanian (58.3%, a difference of 0.14%), Nigerian (58.5%, a difference of 0.17%), Immigrants from Zaire (58.3%, a difference of 0.19%), and Immigrants from Vietnam (58.2%, a difference of 0.23%).
| Demographics | Rating | Rank | College, 1 year or more |
| Guamanians/Chamorros | 26.2 /100 | #196 | Fair 58.6% |
| Immigrants | Thailand | 26.0 /100 | #197 | Fair 58.6% |
| Immigrants | South Eastern Asia | 25.1 /100 | #198 | Fair 58.5% |
| Slovaks | 24.6 /100 | #199 | Fair 58.5% |
| Spanish | 24.2 /100 | #200 | Fair 58.5% |
| Nigerians | 23.0 /100 | #201 | Fair 58.5% |
| Immigrants | South America | 21.9 /100 | #202 | Fair 58.4% |
| Ghanaians | 20.9 /100 | #203 | Fair 58.4% |
| Panamanians | 19.2 /100 | #204 | Poor 58.3% |
| Immigrants | Zaire | 18.7 /100 | #205 | Poor 58.3% |
| Immigrants | Vietnam | 18.2 /100 | #206 | Poor 58.2% |
| Senegalese | 16.9 /100 | #207 | Poor 58.2% |
| Immigrants | Uruguay | 15.2 /100 | #208 | Poor 58.1% |
| Immigrants | Middle Africa | 14.0 /100 | #209 | Poor 58.0% |
| Tsimshian | 13.5 /100 | #210 | Poor 57.9% |
Demographics Similar to Yugoslavians by College, 1 year or more
In terms of college, 1 year or more, the demographic groups most similar to Yugoslavians are Swiss (59.2%, a difference of 0.040%), Immigrants from Bosnia and Herzegovina (59.2%, a difference of 0.070%), Bermudan (59.3%, a difference of 0.14%), Tlingit-Haida (59.4%, a difference of 0.23%), and Czechoslovakian (59.4%, a difference of 0.23%).
| Demographics | Rating | Rank | College, 1 year or more |
| Immigrants | Oceania | 51.2 /100 | #173 | Average 59.4% |
| Celtics | 50.0 /100 | #174 | Average 59.4% |
| Sri Lankans | 49.0 /100 | #175 | Average 59.4% |
| Immigrants | Poland | 48.9 /100 | #176 | Average 59.4% |
| Tlingit-Haida | 48.4 /100 | #177 | Average 59.4% |
| Czechoslovakians | 48.3 /100 | #178 | Average 59.4% |
| Bermudans | 46.6 /100 | #179 | Average 59.3% |
| Yugoslavians | 44.1 /100 | #180 | Average 59.2% |
| Swiss | 43.4 /100 | #181 | Average 59.2% |
| Immigrants | Bosnia and Herzegovina | 42.8 /100 | #182 | Average 59.2% |
| German Russians | 39.3 /100 | #183 | Fair 59.1% |
| Spaniards | 38.3 /100 | #184 | Fair 59.0% |
| South Americans | 35.9 /100 | #185 | Fair 59.0% |
| Scotch-Irish | 34.7 /100 | #186 | Fair 58.9% |
| Germans | 34.7 /100 | #187 | Fair 58.9% |