New Zealander vs Austrian College, Under 1 year
COMPARE
New Zealander
Austrian
College, Under 1 year
College, Under 1 year Comparison
New Zealanders
Austrians
70.2%
COLLEGE, UNDER 1 YEAR
99.9/ 100
METRIC RATING
44th/ 347
METRIC RANK
67.8%
COLLEGE, UNDER 1 YEAR
96.4/ 100
METRIC RATING
107th/ 347
METRIC RANK
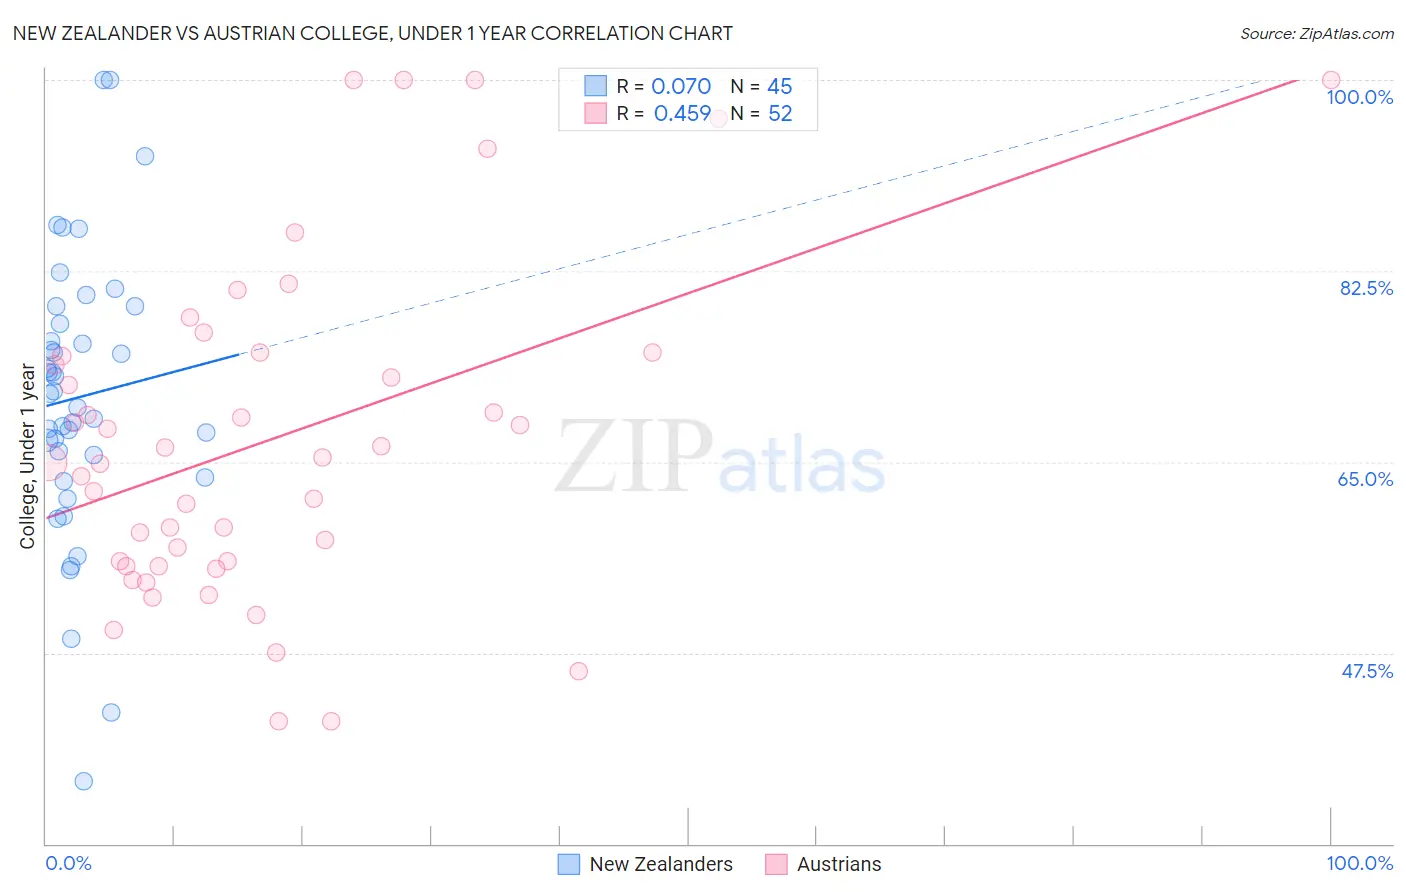
New Zealander vs Austrian College, Under 1 year Correlation Chart
The statistical analysis conducted on geographies consisting of 106,918,889 people shows a slight positive correlation between the proportion of New Zealanders and percentage of population with at least college, under 1 year education in the United States with a correlation coefficient (R) of 0.070 and weighted average of 70.2%. Similarly, the statistical analysis conducted on geographies consisting of 452,079,240 people shows a moderate positive correlation between the proportion of Austrians and percentage of population with at least college, under 1 year education in the United States with a correlation coefficient (R) of 0.459 and weighted average of 67.8%, a difference of 3.6%.
College, Under 1 year Correlation Summary
| Measurement | New Zealander | Austrian |
| Minimum | 35.8% | 41.2% |
| Maximum | 100.0% | 100.0% |
| Range | 64.2% | 58.8% |
| Mean | 70.9% | 67.0% |
| Median | 71.2% | 65.2% |
| Interquartile 25% (IQ1) | 64.6% | 55.7% |
| Interquartile 75% (IQ3) | 78.5% | 74.8% |
| Interquartile Range (IQR) | 13.9% | 19.1% |
| Standard Deviation (Sample) | 12.9% | 15.2% |
| Standard Deviation (Population) | 12.8% | 15.1% |
Similar Demographics by College, Under 1 year
Demographics Similar to New Zealanders by College, Under 1 year
In terms of college, under 1 year, the demographic groups most similar to New Zealanders are Israeli (70.2%, a difference of 0.0%), Immigrants from Norway (70.2%, a difference of 0.020%), Immigrants from Lithuania (70.3%, a difference of 0.070%), Immigrants from Kuwait (70.3%, a difference of 0.12%), and Immigrants from Latvia (70.1%, a difference of 0.14%).
| Demographics | Rating | Rank | College, Under 1 year |
| Immigrants | Saudi Arabia | 99.9 /100 | #37 | Exceptional 70.4% |
| Australians | 99.9 /100 | #38 | Exceptional 70.4% |
| Bhutanese | 99.9 /100 | #39 | Exceptional 70.3% |
| Immigrants | Turkey | 99.9 /100 | #40 | Exceptional 70.3% |
| Immigrants | Kuwait | 99.9 /100 | #41 | Exceptional 70.3% |
| Immigrants | Lithuania | 99.9 /100 | #42 | Exceptional 70.3% |
| Israelis | 99.9 /100 | #43 | Exceptional 70.2% |
| New Zealanders | 99.9 /100 | #44 | Exceptional 70.2% |
| Immigrants | Norway | 99.9 /100 | #45 | Exceptional 70.2% |
| Immigrants | Latvia | 99.9 /100 | #46 | Exceptional 70.1% |
| Immigrants | Bulgaria | 99.8 /100 | #47 | Exceptional 70.0% |
| Immigrants | Netherlands | 99.8 /100 | #48 | Exceptional 70.0% |
| Immigrants | Austria | 99.8 /100 | #49 | Exceptional 70.0% |
| Zimbabweans | 99.8 /100 | #50 | Exceptional 69.9% |
| Mongolians | 99.8 /100 | #51 | Exceptional 69.9% |
Demographics Similar to Austrians by College, Under 1 year
In terms of college, under 1 year, the demographic groups most similar to Austrians are Immigrants from Croatia (67.8%, a difference of 0.060%), Immigrants from Western Asia (67.8%, a difference of 0.070%), Afghan (67.8%, a difference of 0.070%), Immigrants from Egypt (67.7%, a difference of 0.12%), and Carpatho Rusyn (67.9%, a difference of 0.14%).
| Demographics | Rating | Rank | College, Under 1 year |
| Immigrants | Argentina | 97.0 /100 | #100 | Exceptional 67.9% |
| Immigrants | Eastern Europe | 96.9 /100 | #101 | Exceptional 67.9% |
| Palestinians | 96.9 /100 | #102 | Exceptional 67.9% |
| Carpatho Rusyns | 96.8 /100 | #103 | Exceptional 67.9% |
| Immigrants | Western Asia | 96.6 /100 | #104 | Exceptional 67.8% |
| Afghans | 96.6 /100 | #105 | Exceptional 67.8% |
| Immigrants | Croatia | 96.6 /100 | #106 | Exceptional 67.8% |
| Austrians | 96.4 /100 | #107 | Exceptional 67.8% |
| Immigrants | Egypt | 96.0 /100 | #108 | Exceptional 67.7% |
| Scandinavians | 95.8 /100 | #109 | Exceptional 67.7% |
| Assyrians/Chaldeans/Syriacs | 95.8 /100 | #110 | Exceptional 67.7% |
| Ukrainians | 95.8 /100 | #111 | Exceptional 67.7% |
| Macedonians | 95.7 /100 | #112 | Exceptional 67.6% |
| Syrians | 95.6 /100 | #113 | Exceptional 67.6% |
| Chileans | 95.3 /100 | #114 | Exceptional 67.6% |