Immigrants from Senegal vs Austrian College, Under 1 year
COMPARE
Immigrants from Senegal
Austrian
College, Under 1 year
College, Under 1 year Comparison
Immigrants from Senegal
Austrians
63.3%
COLLEGE, UNDER 1 YEAR
5.0/ 100
METRIC RATING
222nd/ 347
METRIC RANK
67.8%
COLLEGE, UNDER 1 YEAR
96.4/ 100
METRIC RATING
107th/ 347
METRIC RANK
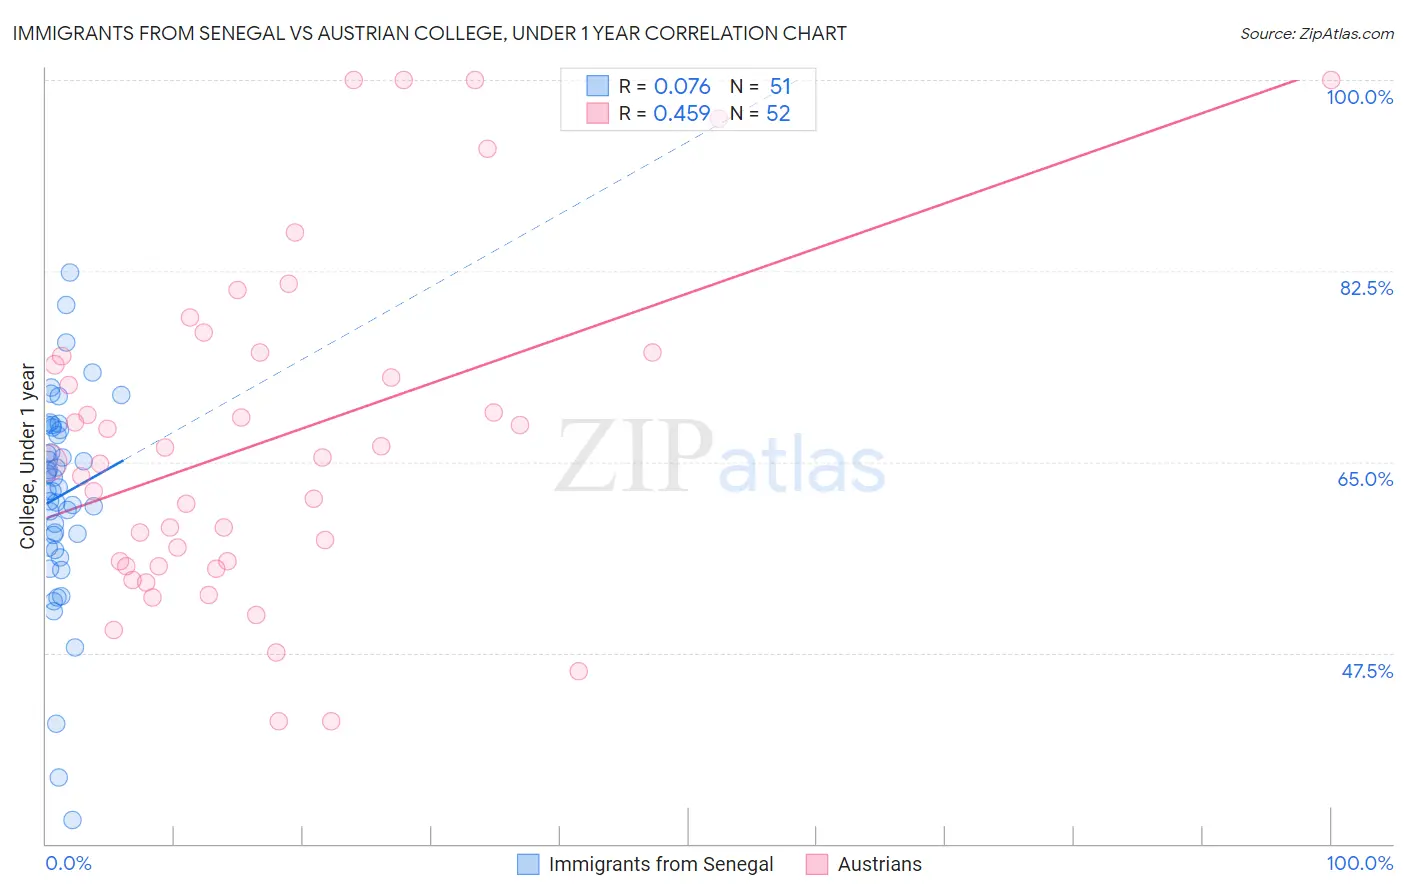
Immigrants from Senegal vs Austrian College, Under 1 year Correlation Chart
The statistical analysis conducted on geographies consisting of 90,129,295 people shows a slight positive correlation between the proportion of Immigrants from Senegal and percentage of population with at least college, under 1 year education in the United States with a correlation coefficient (R) of 0.076 and weighted average of 63.3%. Similarly, the statistical analysis conducted on geographies consisting of 452,079,240 people shows a moderate positive correlation between the proportion of Austrians and percentage of population with at least college, under 1 year education in the United States with a correlation coefficient (R) of 0.459 and weighted average of 67.8%, a difference of 7.1%.
College, Under 1 year Correlation Summary
| Measurement | Immigrants from Senegal | Austrian |
| Minimum | 32.1% | 41.2% |
| Maximum | 82.4% | 100.0% |
| Range | 50.2% | 58.8% |
| Mean | 61.9% | 67.0% |
| Median | 62.6% | 65.2% |
| Interquartile 25% (IQ1) | 57.1% | 55.7% |
| Interquartile 75% (IQ3) | 68.1% | 74.8% |
| Interquartile Range (IQR) | 11.0% | 19.1% |
| Standard Deviation (Sample) | 9.5% | 15.2% |
| Standard Deviation (Population) | 9.4% | 15.1% |
Similar Demographics by College, Under 1 year
Demographics Similar to Immigrants from Senegal by College, Under 1 year
In terms of college, under 1 year, the demographic groups most similar to Immigrants from Senegal are Cree (63.3%, a difference of 0.050%), Immigrants from Costa Rica (63.2%, a difference of 0.12%), Portuguese (63.4%, a difference of 0.14%), Subsaharan African (63.2%, a difference of 0.15%), and Immigrants from Panama (63.4%, a difference of 0.16%).
| Demographics | Rating | Rank | College, Under 1 year |
| Senegalese | 7.7 /100 | #215 | Tragic 63.6% |
| Hmong | 6.8 /100 | #216 | Tragic 63.5% |
| Immigrants | Uruguay | 5.8 /100 | #217 | Tragic 63.4% |
| Immigrants | Panama | 5.7 /100 | #218 | Tragic 63.4% |
| Immigrants | Fiji | 5.7 /100 | #219 | Tragic 63.4% |
| Portuguese | 5.6 /100 | #220 | Tragic 63.4% |
| Cree | 5.2 /100 | #221 | Tragic 63.3% |
| Immigrants | Senegal | 5.0 /100 | #222 | Tragic 63.3% |
| Immigrants | Costa Rica | 4.5 /100 | #223 | Tragic 63.2% |
| Sub-Saharan Africans | 4.4 /100 | #224 | Tragic 63.2% |
| Immigrants | Peru | 4.0 /100 | #225 | Tragic 63.1% |
| Immigrants | Colombia | 4.0 /100 | #226 | Tragic 63.1% |
| Immigrants | Ghana | 3.7 /100 | #227 | Tragic 63.1% |
| Samoans | 3.3 /100 | #228 | Tragic 63.0% |
| Liberians | 3.2 /100 | #229 | Tragic 63.0% |
Demographics Similar to Austrians by College, Under 1 year
In terms of college, under 1 year, the demographic groups most similar to Austrians are Immigrants from Croatia (67.8%, a difference of 0.060%), Immigrants from Western Asia (67.8%, a difference of 0.070%), Afghan (67.8%, a difference of 0.070%), Immigrants from Egypt (67.7%, a difference of 0.12%), and Carpatho Rusyn (67.9%, a difference of 0.14%).
| Demographics | Rating | Rank | College, Under 1 year |
| Immigrants | Argentina | 97.0 /100 | #100 | Exceptional 67.9% |
| Immigrants | Eastern Europe | 96.9 /100 | #101 | Exceptional 67.9% |
| Palestinians | 96.9 /100 | #102 | Exceptional 67.9% |
| Carpatho Rusyns | 96.8 /100 | #103 | Exceptional 67.9% |
| Immigrants | Western Asia | 96.6 /100 | #104 | Exceptional 67.8% |
| Afghans | 96.6 /100 | #105 | Exceptional 67.8% |
| Immigrants | Croatia | 96.6 /100 | #106 | Exceptional 67.8% |
| Austrians | 96.4 /100 | #107 | Exceptional 67.8% |
| Immigrants | Egypt | 96.0 /100 | #108 | Exceptional 67.7% |
| Scandinavians | 95.8 /100 | #109 | Exceptional 67.7% |
| Assyrians/Chaldeans/Syriacs | 95.8 /100 | #110 | Exceptional 67.7% |
| Ukrainians | 95.8 /100 | #111 | Exceptional 67.7% |
| Macedonians | 95.7 /100 | #112 | Exceptional 67.6% |
| Syrians | 95.6 /100 | #113 | Exceptional 67.6% |
| Chileans | 95.3 /100 | #114 | Exceptional 67.6% |