Immigrants from Romania vs Scandinavian GED/Equivalency
COMPARE
Immigrants from Romania
Scandinavian
GED/Equivalency
GED/Equivalency Comparison
Immigrants from Romania
Scandinavians
87.5%
GED/EQUIVALENCY
98.1/ 100
METRIC RATING
84th/ 347
METRIC RANK
87.9%
GED/EQUIVALENCY
99.3/ 100
METRIC RATING
60th/ 347
METRIC RANK
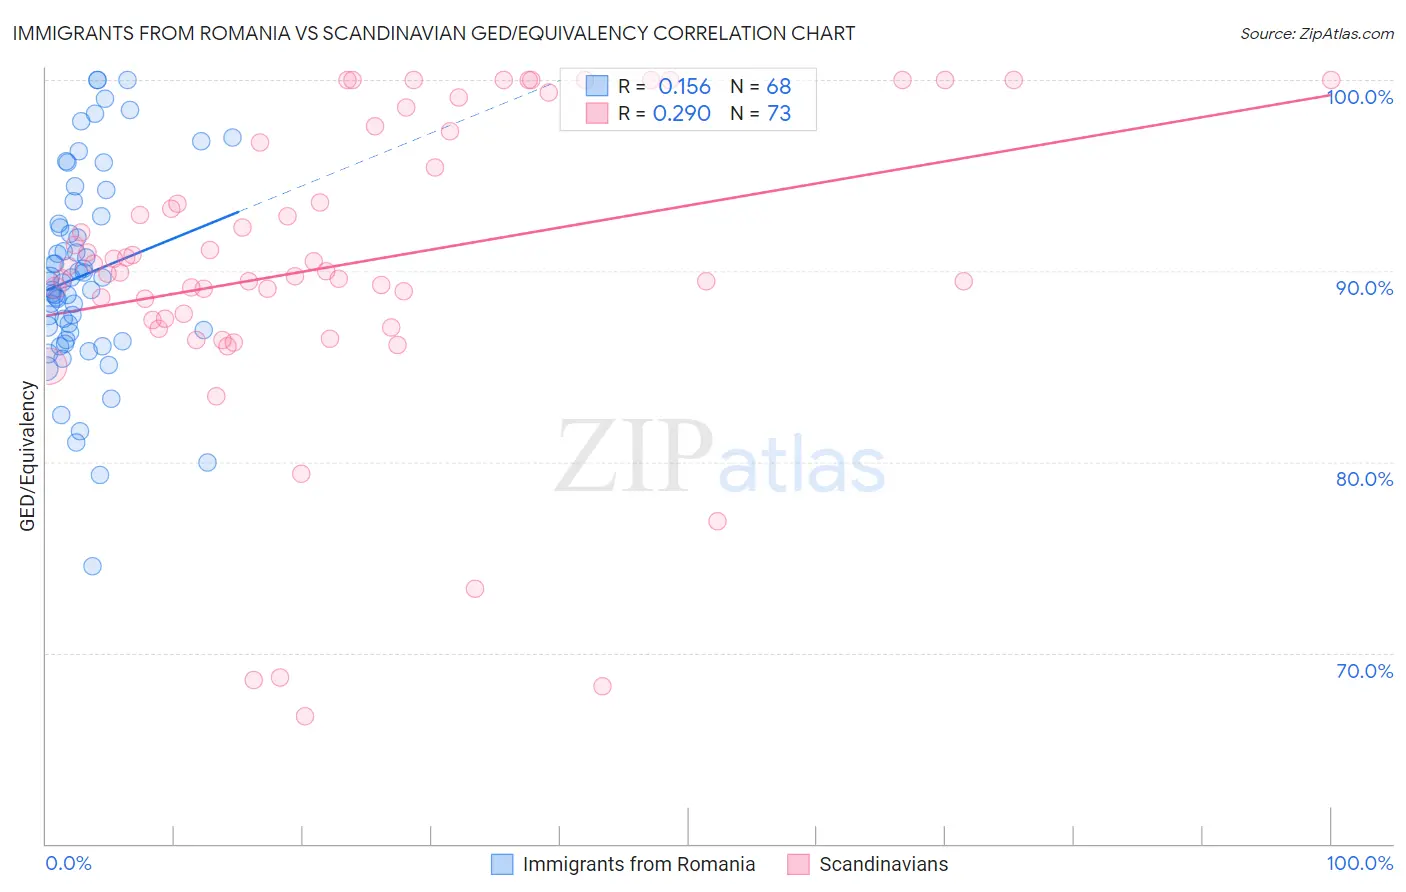
Immigrants from Romania vs Scandinavian GED/Equivalency Correlation Chart
The statistical analysis conducted on geographies consisting of 257,013,054 people shows a poor positive correlation between the proportion of Immigrants from Romania and percentage of population with at least ged/equivalency education in the United States with a correlation coefficient (R) of 0.156 and weighted average of 87.5%. Similarly, the statistical analysis conducted on geographies consisting of 472,660,435 people shows a weak positive correlation between the proportion of Scandinavians and percentage of population with at least ged/equivalency education in the United States with a correlation coefficient (R) of 0.290 and weighted average of 87.9%, a difference of 0.48%.
GED/Equivalency Correlation Summary
| Measurement | Immigrants from Romania | Scandinavian |
| Minimum | 74.6% | 66.7% |
| Maximum | 100.0% | 100.0% |
| Range | 25.4% | 33.3% |
| Mean | 89.8% | 90.3% |
| Median | 89.4% | 90.0% |
| Interquartile 25% (IQ1) | 86.6% | 87.5% |
| Interquartile 75% (IQ3) | 92.7% | 97.0% |
| Interquartile Range (IQR) | 6.1% | 9.6% |
| Standard Deviation (Sample) | 5.3% | 7.9% |
| Standard Deviation (Population) | 5.2% | 7.8% |
Similar Demographics by GED/Equivalency
Demographics Similar to Immigrants from Romania by GED/Equivalency
In terms of ged/equivalency, the demographic groups most similar to Immigrants from Romania are Dutch (87.5%, a difference of 0.0%), Immigrants from Europe (87.5%, a difference of 0.010%), Native Hawaiian (87.5%, a difference of 0.010%), Immigrants from Norway (87.5%, a difference of 0.020%), and South African (87.5%, a difference of 0.040%).
| Demographics | Rating | Rank | GED/Equivalency |
| Slavs | 98.7 /100 | #77 | Exceptional 87.7% |
| Irish | 98.6 /100 | #78 | Exceptional 87.6% |
| English | 98.6 /100 | #79 | Exceptional 87.6% |
| Immigrants | England | 98.5 /100 | #80 | Exceptional 87.6% |
| Immigrants | Sri Lanka | 98.3 /100 | #81 | Exceptional 87.5% |
| Romanians | 98.3 /100 | #82 | Exceptional 87.5% |
| South Africans | 98.3 /100 | #83 | Exceptional 87.5% |
| Immigrants | Romania | 98.1 /100 | #84 | Exceptional 87.5% |
| Dutch | 98.1 /100 | #85 | Exceptional 87.5% |
| Immigrants | Europe | 98.1 /100 | #86 | Exceptional 87.5% |
| Native Hawaiians | 98.1 /100 | #87 | Exceptional 87.5% |
| Immigrants | Norway | 98.1 /100 | #88 | Exceptional 87.5% |
| Hungarians | 97.9 /100 | #89 | Exceptional 87.4% |
| Welsh | 97.9 /100 | #90 | Exceptional 87.4% |
| Immigrants | Eastern Asia | 97.9 /100 | #91 | Exceptional 87.4% |
Demographics Similar to Scandinavians by GED/Equivalency
In terms of ged/equivalency, the demographic groups most similar to Scandinavians are European (87.9%, a difference of 0.0%), Serbian (87.9%, a difference of 0.010%), Immigrants from Czechoslovakia (87.9%, a difference of 0.020%), Northern European (87.9%, a difference of 0.020%), and German (87.9%, a difference of 0.020%).
| Demographics | Rating | Rank | GED/Equivalency |
| Immigrants | South Africa | 99.4 /100 | #53 | Exceptional 88.0% |
| Soviet Union | 99.4 /100 | #54 | Exceptional 88.0% |
| New Zealanders | 99.4 /100 | #55 | Exceptional 88.0% |
| Immigrants | Denmark | 99.4 /100 | #56 | Exceptional 88.0% |
| Immigrants | Czechoslovakia | 99.3 /100 | #57 | Exceptional 87.9% |
| Northern Europeans | 99.3 /100 | #58 | Exceptional 87.9% |
| Serbians | 99.3 /100 | #59 | Exceptional 87.9% |
| Scandinavians | 99.3 /100 | #60 | Exceptional 87.9% |
| Europeans | 99.3 /100 | #61 | Exceptional 87.9% |
| Germans | 99.3 /100 | #62 | Exceptional 87.9% |
| Immigrants | Turkey | 99.2 /100 | #63 | Exceptional 87.9% |
| Immigrants | Canada | 99.2 /100 | #64 | Exceptional 87.9% |
| Immigrants | North America | 99.1 /100 | #65 | Exceptional 87.8% |
| Immigrants | Bulgaria | 99.1 /100 | #66 | Exceptional 87.8% |
| British | 99.1 /100 | #67 | Exceptional 87.8% |