Finnish vs Celtic No Schooling Completed
COMPARE
Finnish
Celtic
No Schooling Completed
No Schooling Completed Comparison
Finns
Celtics
1.5%
NO SCHOOLING COMPLETED
100.0/ 100
METRIC RATING
16th/ 347
METRIC RANK
1.6%
NO SCHOOLING COMPLETED
99.9/ 100
METRIC RATING
50th/ 347
METRIC RANK
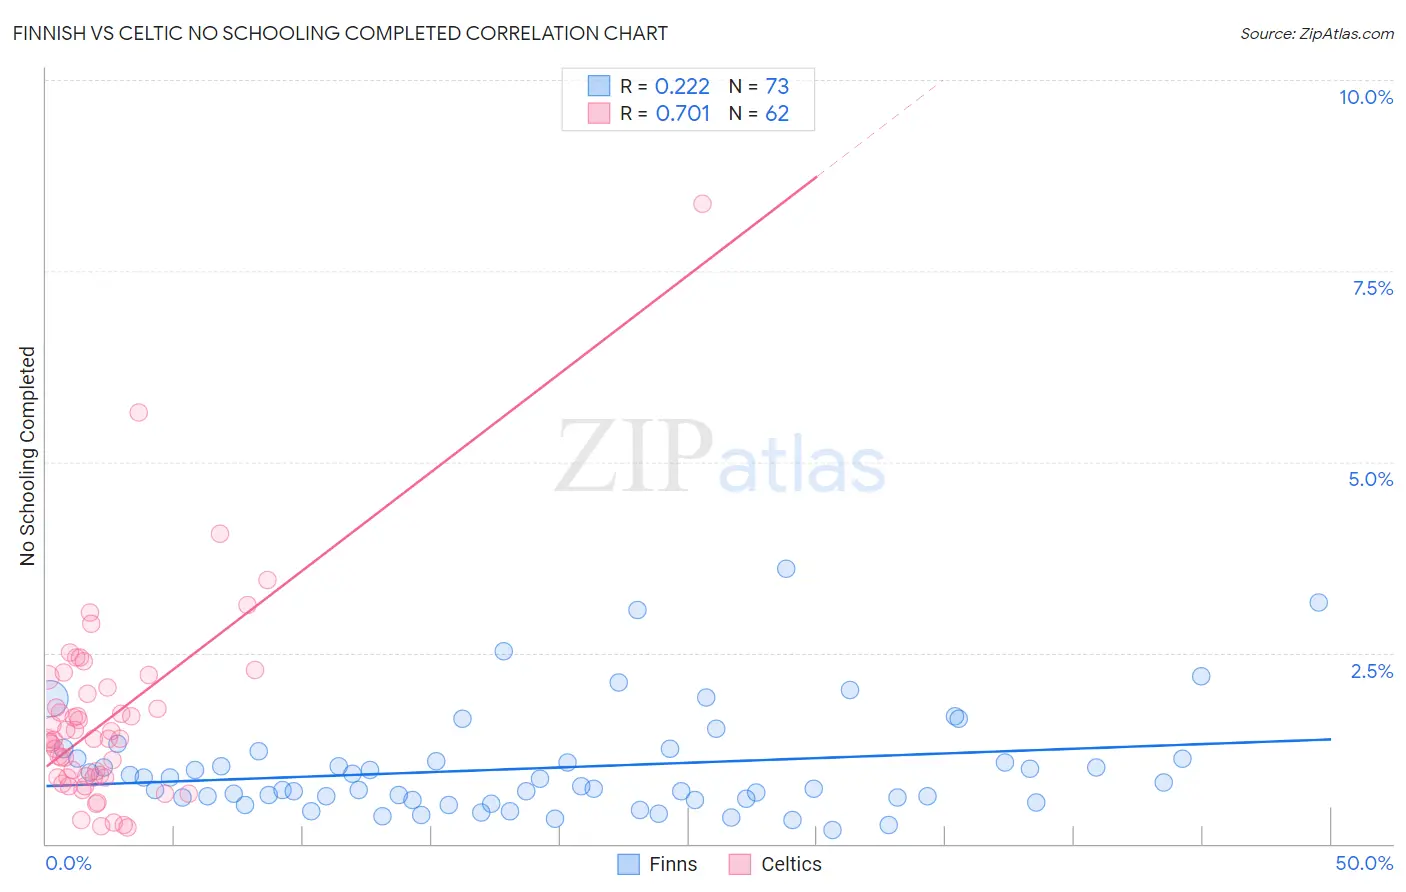
Finnish vs Celtic No Schooling Completed Correlation Chart
The statistical analysis conducted on geographies consisting of 398,073,835 people shows a weak positive correlation between the proportion of Finns and percentage of population with no schooling in the United States with a correlation coefficient (R) of 0.222 and weighted average of 1.5%. Similarly, the statistical analysis conducted on geographies consisting of 167,819,688 people shows a strong positive correlation between the proportion of Celtics and percentage of population with no schooling in the United States with a correlation coefficient (R) of 0.701 and weighted average of 1.6%, a difference of 11.8%.
No Schooling Completed Correlation Summary
| Measurement | Finnish | Celtic |
| Minimum | 0.18% | 0.22% |
| Maximum | 3.6% | 8.4% |
| Range | 3.4% | 8.2% |
| Mean | 0.99% | 1.6% |
| Median | 0.75% | 1.4% |
| Interquartile 25% (IQ1) | 0.58% | 0.87% |
| Interquartile 75% (IQ3) | 1.1% | 2.0% |
| Interquartile Range (IQR) | 0.53% | 1.2% |
| Standard Deviation (Sample) | 0.68% | 1.3% |
| Standard Deviation (Population) | 0.68% | 1.3% |
Similar Demographics by No Schooling Completed
Demographics Similar to Finns by No Schooling Completed
In terms of no schooling completed, the demographic groups most similar to Finns are Croatian (1.5%, a difference of 0.010%), Danish (1.5%, a difference of 0.31%), Alaskan Athabascan (1.5%, a difference of 0.42%), Tlingit-Haida (1.5%, a difference of 0.52%), and Welsh (1.5%, a difference of 0.54%).
| Demographics | Rating | Rank | No Schooling Completed |
| Scottish | 100.0 /100 | #9 | Exceptional 1.4% |
| Dutch | 100.0 /100 | #10 | Exceptional 1.4% |
| Lithuanians | 100.0 /100 | #11 | Exceptional 1.4% |
| Irish | 100.0 /100 | #12 | Exceptional 1.4% |
| Poles | 100.0 /100 | #13 | Exceptional 1.4% |
| Scotch-Irish | 100.0 /100 | #14 | Exceptional 1.5% |
| Tlingit-Haida | 100.0 /100 | #15 | Exceptional 1.5% |
| Finns | 100.0 /100 | #16 | Exceptional 1.5% |
| Croatians | 100.0 /100 | #17 | Exceptional 1.5% |
| Danes | 100.0 /100 | #18 | Exceptional 1.5% |
| Alaskan Athabascans | 100.0 /100 | #19 | Exceptional 1.5% |
| Welsh | 100.0 /100 | #20 | Exceptional 1.5% |
| Chinese | 100.0 /100 | #21 | Exceptional 1.5% |
| Alaska Natives | 100.0 /100 | #22 | Exceptional 1.5% |
| Europeans | 100.0 /100 | #23 | Exceptional 1.5% |
Demographics Similar to Celtics by No Schooling Completed
In terms of no schooling completed, the demographic groups most similar to Celtics are White/Caucasian (1.6%, a difference of 0.13%), Immigrants from Scotland (1.6%, a difference of 0.19%), Chippewa (1.6%, a difference of 0.20%), Immigrants from Canada (1.6%, a difference of 0.27%), and Creek (1.6%, a difference of 0.40%).
| Demographics | Rating | Rank | No Schooling Completed |
| Australians | 99.9 /100 | #43 | Exceptional 1.6% |
| Estonians | 99.9 /100 | #44 | Exceptional 1.6% |
| Czechoslovakians | 99.9 /100 | #45 | Exceptional 1.6% |
| Maltese | 99.9 /100 | #46 | Exceptional 1.6% |
| Ottawa | 99.9 /100 | #47 | Exceptional 1.6% |
| Immigrants | Scotland | 99.9 /100 | #48 | Exceptional 1.6% |
| Whites/Caucasians | 99.9 /100 | #49 | Exceptional 1.6% |
| Celtics | 99.9 /100 | #50 | Exceptional 1.6% |
| Chippewa | 99.8 /100 | #51 | Exceptional 1.6% |
| Immigrants | Canada | 99.8 /100 | #52 | Exceptional 1.6% |
| Creek | 99.8 /100 | #53 | Exceptional 1.6% |
| Crow | 99.8 /100 | #54 | Exceptional 1.6% |
| Greeks | 99.8 /100 | #55 | Exceptional 1.6% |
| Immigrants | North America | 99.8 /100 | #56 | Exceptional 1.6% |
| Austrians | 99.8 /100 | #57 | Exceptional 1.6% |