Finnish vs Immigrants from Spain No Schooling Completed
COMPARE
Finnish
Immigrants from Spain
No Schooling Completed
No Schooling Completed Comparison
Finns
Immigrants from Spain
1.5%
NO SCHOOLING COMPLETED
100.0/ 100
METRIC RATING
16th/ 347
METRIC RANK
2.0%
NO SCHOOLING COMPLETED
66.4/ 100
METRIC RATING
159th/ 347
METRIC RANK
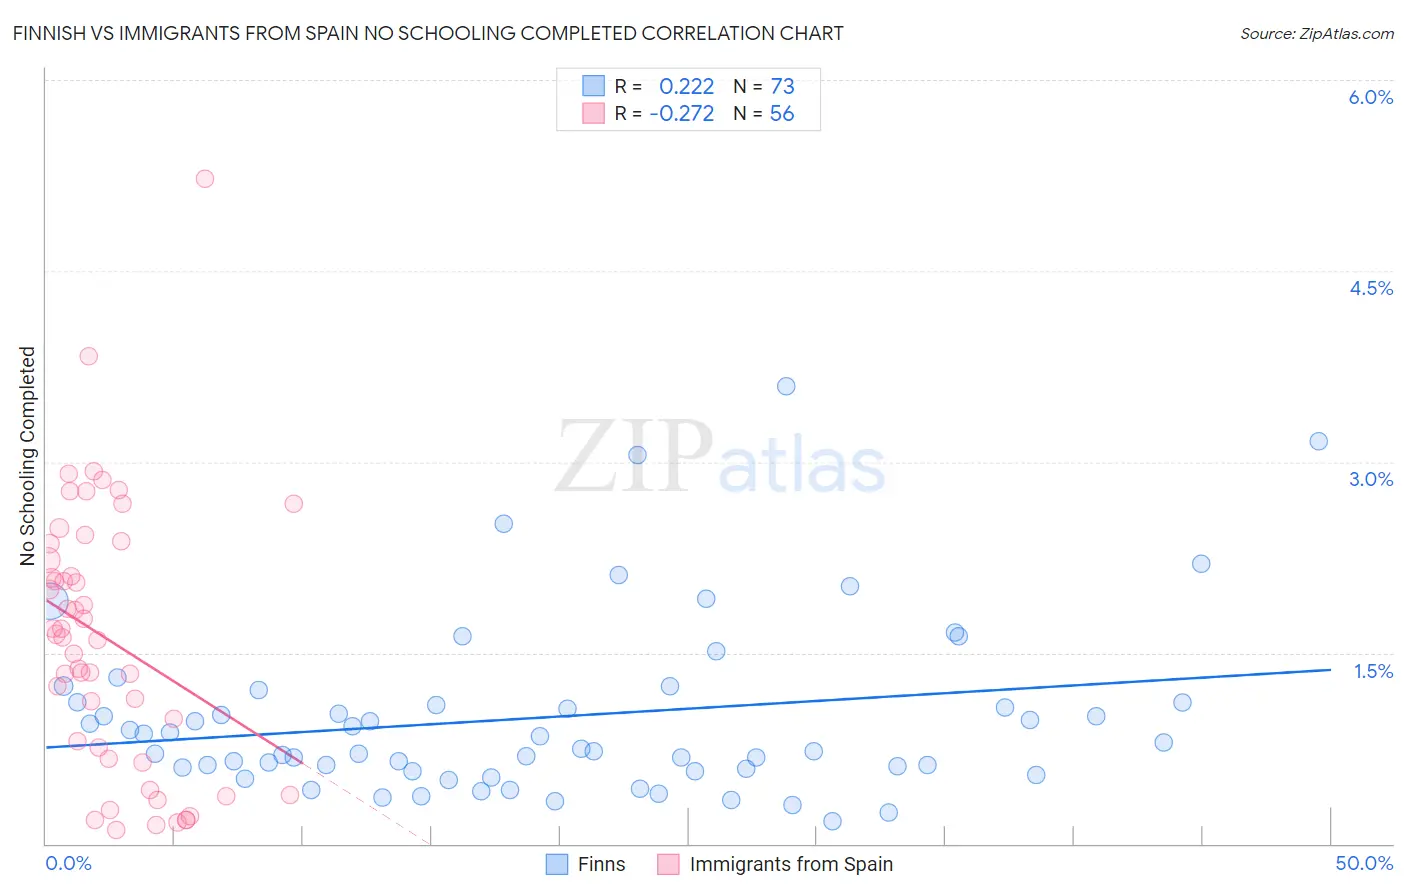
Finnish vs Immigrants from Spain No Schooling Completed Correlation Chart
The statistical analysis conducted on geographies consisting of 398,073,835 people shows a weak positive correlation between the proportion of Finns and percentage of population with no schooling in the United States with a correlation coefficient (R) of 0.222 and weighted average of 1.5%. Similarly, the statistical analysis conducted on geographies consisting of 238,284,767 people shows a weak negative correlation between the proportion of Immigrants from Spain and percentage of population with no schooling in the United States with a correlation coefficient (R) of -0.272 and weighted average of 2.0%, a difference of 40.0%.
No Schooling Completed Correlation Summary
| Measurement | Finnish | Immigrants from Spain |
| Minimum | 0.18% | 0.11% |
| Maximum | 3.6% | 5.2% |
| Range | 3.4% | 5.1% |
| Mean | 0.99% | 1.6% |
| Median | 0.75% | 1.6% |
| Interquartile 25% (IQ1) | 0.58% | 0.72% |
| Interquartile 75% (IQ3) | 1.1% | 2.3% |
| Interquartile Range (IQR) | 0.53% | 1.6% |
| Standard Deviation (Sample) | 0.68% | 1.0% |
| Standard Deviation (Population) | 0.68% | 1.0% |
Similar Demographics by No Schooling Completed
Demographics Similar to Finns by No Schooling Completed
In terms of no schooling completed, the demographic groups most similar to Finns are Croatian (1.5%, a difference of 0.010%), Danish (1.5%, a difference of 0.31%), Alaskan Athabascan (1.5%, a difference of 0.42%), Tlingit-Haida (1.5%, a difference of 0.52%), and Welsh (1.5%, a difference of 0.54%).
| Demographics | Rating | Rank | No Schooling Completed |
| Scottish | 100.0 /100 | #9 | Exceptional 1.4% |
| Dutch | 100.0 /100 | #10 | Exceptional 1.4% |
| Lithuanians | 100.0 /100 | #11 | Exceptional 1.4% |
| Irish | 100.0 /100 | #12 | Exceptional 1.4% |
| Poles | 100.0 /100 | #13 | Exceptional 1.4% |
| Scotch-Irish | 100.0 /100 | #14 | Exceptional 1.5% |
| Tlingit-Haida | 100.0 /100 | #15 | Exceptional 1.5% |
| Finns | 100.0 /100 | #16 | Exceptional 1.5% |
| Croatians | 100.0 /100 | #17 | Exceptional 1.5% |
| Danes | 100.0 /100 | #18 | Exceptional 1.5% |
| Alaskan Athabascans | 100.0 /100 | #19 | Exceptional 1.5% |
| Welsh | 100.0 /100 | #20 | Exceptional 1.5% |
| Chinese | 100.0 /100 | #21 | Exceptional 1.5% |
| Alaska Natives | 100.0 /100 | #22 | Exceptional 1.5% |
| Europeans | 100.0 /100 | #23 | Exceptional 1.5% |
Demographics Similar to Immigrants from Spain by No Schooling Completed
In terms of no schooling completed, the demographic groups most similar to Immigrants from Spain are Immigrants from Korea (2.0%, a difference of 0.050%), Immigrants from Sri Lanka (2.0%, a difference of 0.090%), Chilean (2.0%, a difference of 0.12%), Kenyan (2.0%, a difference of 0.12%), and Immigrants from Russia (2.0%, a difference of 0.19%).
| Demographics | Rating | Rank | No Schooling Completed |
| Immigrants | Eastern Europe | 70.4 /100 | #152 | Good 2.0% |
| Immigrants | Italy | 68.9 /100 | #153 | Good 2.0% |
| Immigrants | Venezuela | 68.5 /100 | #154 | Good 2.0% |
| Immigrants | Russia | 67.6 /100 | #155 | Good 2.0% |
| Chileans | 67.2 /100 | #156 | Good 2.0% |
| Immigrants | Sri Lanka | 67.0 /100 | #157 | Good 2.0% |
| Immigrants | Korea | 66.7 /100 | #158 | Good 2.0% |
| Immigrants | Spain | 66.4 /100 | #159 | Good 2.0% |
| Kenyans | 65.7 /100 | #160 | Good 2.0% |
| Ugandans | 64.6 /100 | #161 | Good 2.0% |
| Immigrants | Brazil | 63.8 /100 | #162 | Good 2.1% |
| Albanians | 62.2 /100 | #163 | Good 2.1% |
| Comanche | 60.7 /100 | #164 | Good 2.1% |
| Brazilians | 60.2 /100 | #165 | Good 2.1% |
| Dutch West Indians | 59.9 /100 | #166 | Average 2.1% |