Finnish vs Immigrants from Ecuador No Schooling Completed
COMPARE
Finnish
Immigrants from Ecuador
No Schooling Completed
No Schooling Completed Comparison
Finns
Immigrants from Ecuador
1.5%
NO SCHOOLING COMPLETED
100.0/ 100
METRIC RATING
16th/ 347
METRIC RANK
3.1%
NO SCHOOLING COMPLETED
0.0/ 100
METRIC RATING
316th/ 347
METRIC RANK
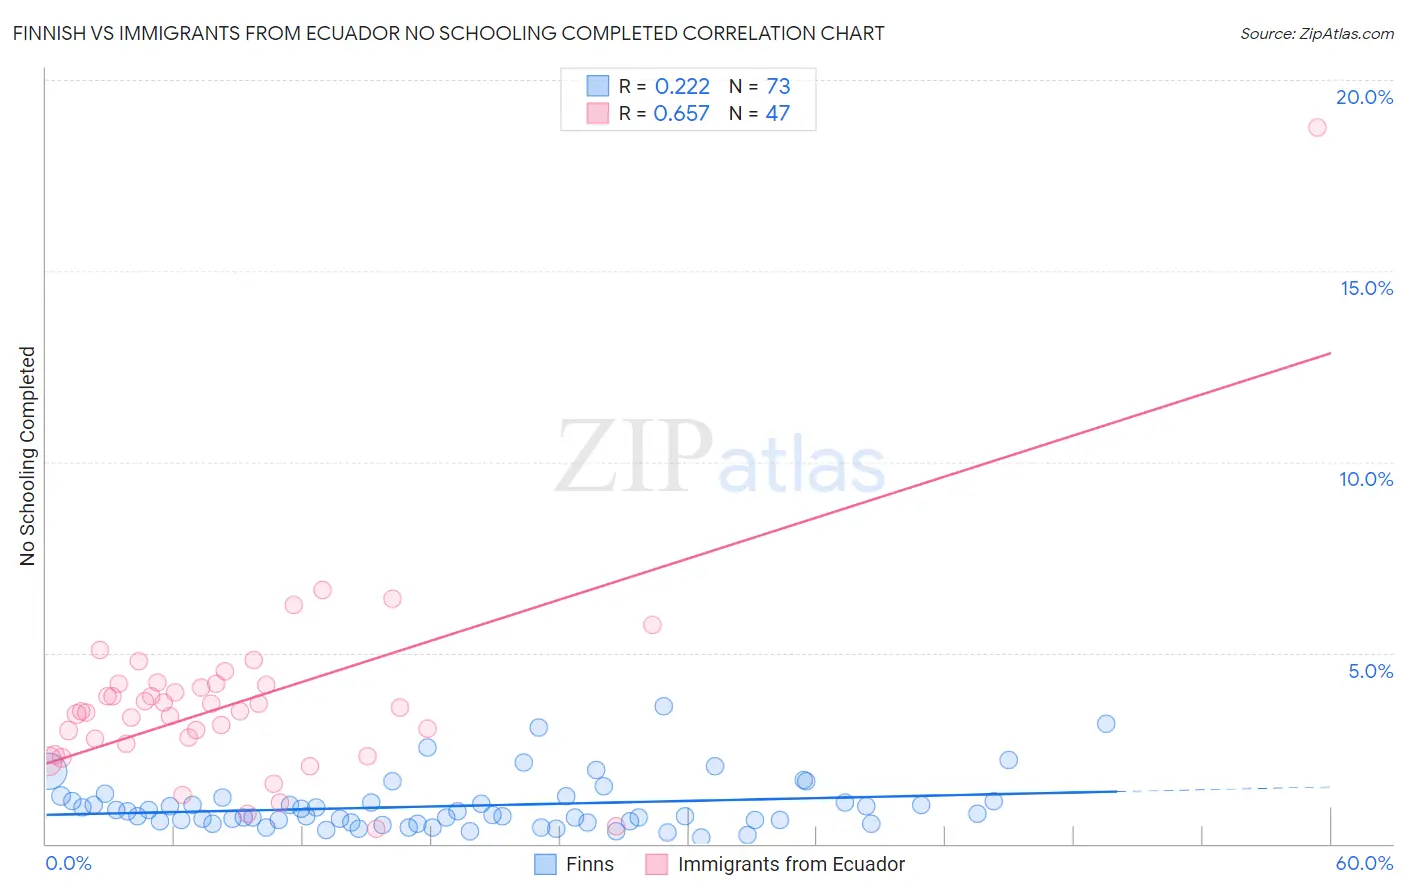
Finnish vs Immigrants from Ecuador No Schooling Completed Correlation Chart
The statistical analysis conducted on geographies consisting of 398,073,835 people shows a weak positive correlation between the proportion of Finns and percentage of population with no schooling in the United States with a correlation coefficient (R) of 0.222 and weighted average of 1.5%. Similarly, the statistical analysis conducted on geographies consisting of 269,548,535 people shows a significant positive correlation between the proportion of Immigrants from Ecuador and percentage of population with no schooling in the United States with a correlation coefficient (R) of 0.657 and weighted average of 3.1%, a difference of 111.3%.
No Schooling Completed Correlation Summary
| Measurement | Finnish | Immigrants from Ecuador |
| Minimum | 0.18% | 0.40% |
| Maximum | 3.6% | 18.8% |
| Range | 3.4% | 18.3% |
| Mean | 0.99% | 3.7% |
| Median | 0.75% | 3.5% |
| Interquartile 25% (IQ1) | 0.58% | 2.6% |
| Interquartile 75% (IQ3) | 1.1% | 4.2% |
| Interquartile Range (IQR) | 0.53% | 1.5% |
| Standard Deviation (Sample) | 0.68% | 2.6% |
| Standard Deviation (Population) | 0.68% | 2.6% |
Similar Demographics by No Schooling Completed
Demographics Similar to Finns by No Schooling Completed
In terms of no schooling completed, the demographic groups most similar to Finns are Croatian (1.5%, a difference of 0.010%), Danish (1.5%, a difference of 0.31%), Alaskan Athabascan (1.5%, a difference of 0.42%), Tlingit-Haida (1.5%, a difference of 0.52%), and Welsh (1.5%, a difference of 0.54%).
| Demographics | Rating | Rank | No Schooling Completed |
| Scottish | 100.0 /100 | #9 | Exceptional 1.4% |
| Dutch | 100.0 /100 | #10 | Exceptional 1.4% |
| Lithuanians | 100.0 /100 | #11 | Exceptional 1.4% |
| Irish | 100.0 /100 | #12 | Exceptional 1.4% |
| Poles | 100.0 /100 | #13 | Exceptional 1.4% |
| Scotch-Irish | 100.0 /100 | #14 | Exceptional 1.5% |
| Tlingit-Haida | 100.0 /100 | #15 | Exceptional 1.5% |
| Finns | 100.0 /100 | #16 | Exceptional 1.5% |
| Croatians | 100.0 /100 | #17 | Exceptional 1.5% |
| Danes | 100.0 /100 | #18 | Exceptional 1.5% |
| Alaskan Athabascans | 100.0 /100 | #19 | Exceptional 1.5% |
| Welsh | 100.0 /100 | #20 | Exceptional 1.5% |
| Chinese | 100.0 /100 | #21 | Exceptional 1.5% |
| Alaska Natives | 100.0 /100 | #22 | Exceptional 1.5% |
| Europeans | 100.0 /100 | #23 | Exceptional 1.5% |
Demographics Similar to Immigrants from Ecuador by No Schooling Completed
In terms of no schooling completed, the demographic groups most similar to Immigrants from Ecuador are Immigrants from Nicaragua (3.1%, a difference of 0.36%), Cape Verdean (3.1%, a difference of 0.49%), Immigrants from Belize (3.1%, a difference of 0.60%), Honduran (3.1%, a difference of 0.69%), and Immigrants from Guyana (3.1%, a difference of 1.2%).
| Demographics | Rating | Rank | No Schooling Completed |
| Hispanics or Latinos | 0.0 /100 | #309 | Tragic 3.0% |
| Guyanese | 0.0 /100 | #310 | Tragic 3.0% |
| Immigrants | Azores | 0.0 /100 | #311 | Tragic 3.0% |
| Sri Lankans | 0.0 /100 | #312 | Tragic 3.0% |
| Hondurans | 0.0 /100 | #313 | Tragic 3.1% |
| Immigrants | Belize | 0.0 /100 | #314 | Tragic 3.1% |
| Immigrants | Nicaragua | 0.0 /100 | #315 | Tragic 3.1% |
| Immigrants | Ecuador | 0.0 /100 | #316 | Tragic 3.1% |
| Cape Verdeans | 0.0 /100 | #317 | Tragic 3.1% |
| Immigrants | Guyana | 0.0 /100 | #318 | Tragic 3.1% |
| Immigrants | Burma/Myanmar | 0.0 /100 | #319 | Tragic 3.1% |
| Immigrants | Bangladesh | 0.0 /100 | #320 | Tragic 3.1% |
| Immigrants | Laos | 0.0 /100 | #321 | Tragic 3.1% |
| Immigrants | Honduras | 0.0 /100 | #322 | Tragic 3.2% |
| Vietnamese | 0.0 /100 | #323 | Tragic 3.2% |