Finnish vs Tohono O'odham No Schooling Completed
COMPARE
Finnish
Tohono O'odham
No Schooling Completed
No Schooling Completed Comparison
Finns
Tohono O'odham
1.5%
NO SCHOOLING COMPLETED
100.0/ 100
METRIC RATING
16th/ 347
METRIC RANK
2.3%
NO SCHOOLING COMPLETED
4.1/ 100
METRIC RATING
224th/ 347
METRIC RANK
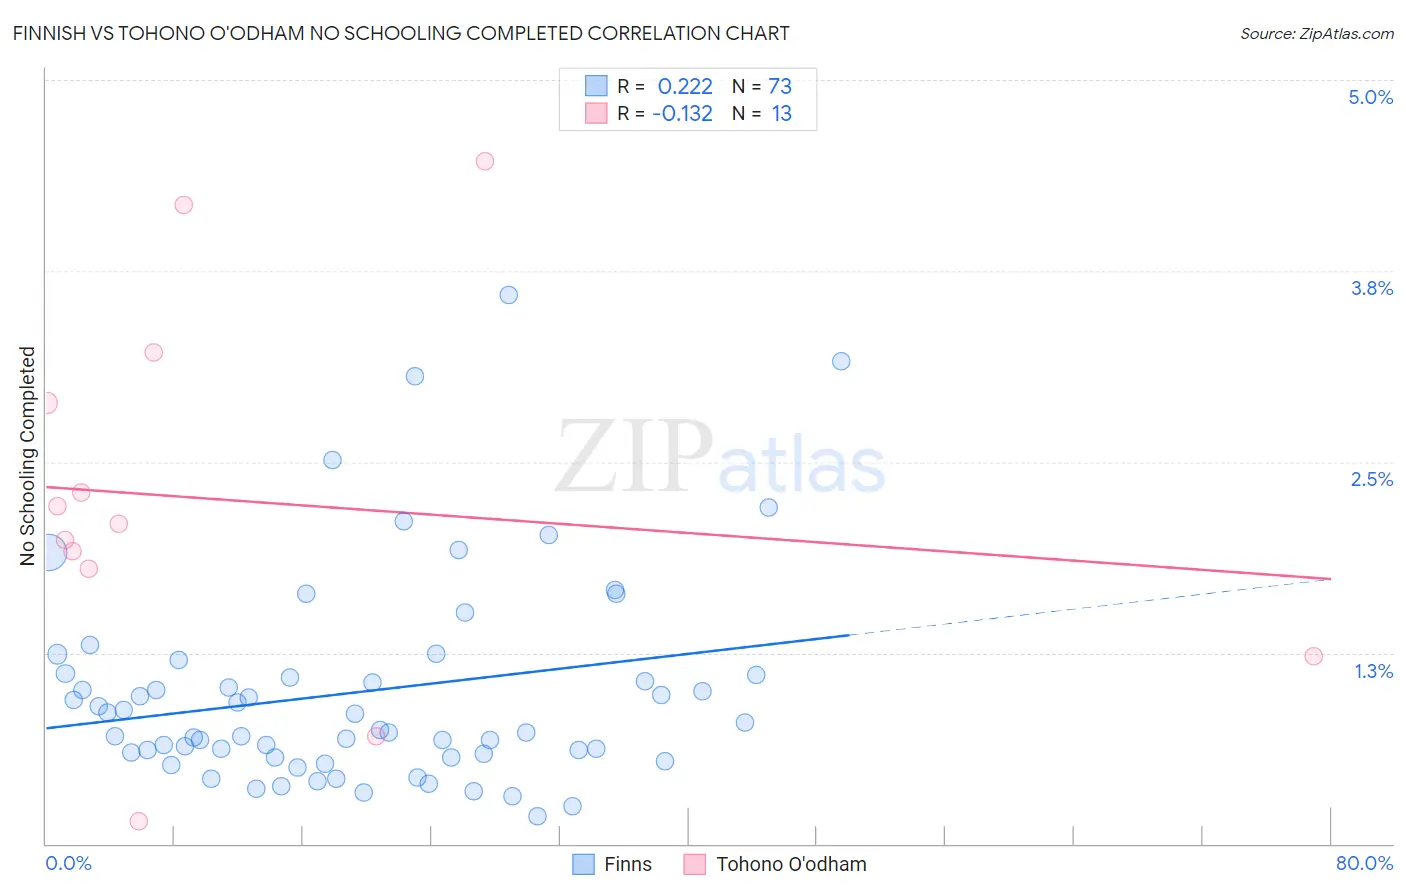
Finnish vs Tohono O'odham No Schooling Completed Correlation Chart
The statistical analysis conducted on geographies consisting of 398,073,835 people shows a weak positive correlation between the proportion of Finns and percentage of population with no schooling in the United States with a correlation coefficient (R) of 0.222 and weighted average of 1.5%. Similarly, the statistical analysis conducted on geographies consisting of 58,626,316 people shows a poor negative correlation between the proportion of Tohono O'odham and percentage of population with no schooling in the United States with a correlation coefficient (R) of -0.132 and weighted average of 2.3%, a difference of 58.4%.
No Schooling Completed Correlation Summary
| Measurement | Finnish | Tohono O'odham |
| Minimum | 0.18% | 0.14% |
| Maximum | 3.6% | 4.5% |
| Range | 3.4% | 4.3% |
| Mean | 0.99% | 2.2% |
| Median | 0.75% | 2.1% |
| Interquartile 25% (IQ1) | 0.58% | 1.5% |
| Interquartile 75% (IQ3) | 1.1% | 3.1% |
| Interquartile Range (IQR) | 0.53% | 1.5% |
| Standard Deviation (Sample) | 0.68% | 1.2% |
| Standard Deviation (Population) | 0.68% | 1.2% |
Similar Demographics by No Schooling Completed
Demographics Similar to Finns by No Schooling Completed
In terms of no schooling completed, the demographic groups most similar to Finns are Croatian (1.5%, a difference of 0.010%), Danish (1.5%, a difference of 0.31%), Alaskan Athabascan (1.5%, a difference of 0.42%), Tlingit-Haida (1.5%, a difference of 0.52%), and Welsh (1.5%, a difference of 0.54%).
| Demographics | Rating | Rank | No Schooling Completed |
| Scottish | 100.0 /100 | #9 | Exceptional 1.4% |
| Dutch | 100.0 /100 | #10 | Exceptional 1.4% |
| Lithuanians | 100.0 /100 | #11 | Exceptional 1.4% |
| Irish | 100.0 /100 | #12 | Exceptional 1.4% |
| Poles | 100.0 /100 | #13 | Exceptional 1.4% |
| Scotch-Irish | 100.0 /100 | #14 | Exceptional 1.5% |
| Tlingit-Haida | 100.0 /100 | #15 | Exceptional 1.5% |
| Finns | 100.0 /100 | #16 | Exceptional 1.5% |
| Croatians | 100.0 /100 | #17 | Exceptional 1.5% |
| Danes | 100.0 /100 | #18 | Exceptional 1.5% |
| Alaskan Athabascans | 100.0 /100 | #19 | Exceptional 1.5% |
| Welsh | 100.0 /100 | #20 | Exceptional 1.5% |
| Chinese | 100.0 /100 | #21 | Exceptional 1.5% |
| Alaska Natives | 100.0 /100 | #22 | Exceptional 1.5% |
| Europeans | 100.0 /100 | #23 | Exceptional 1.5% |
Demographics Similar to Tohono O'odham by No Schooling Completed
In terms of no schooling completed, the demographic groups most similar to Tohono O'odham are Sudanese (2.3%, a difference of 0.0%), Sierra Leonean (2.3%, a difference of 0.020%), Immigrants from Uganda (2.3%, a difference of 0.070%), Immigrants from Lebanon (2.3%, a difference of 0.29%), and U.S. Virgin Islander (2.3%, a difference of 0.36%).
| Demographics | Rating | Rank | No Schooling Completed |
| Immigrants | Syria | 6.6 /100 | #217 | Tragic 2.3% |
| Immigrants | Nepal | 6.4 /100 | #218 | Tragic 2.3% |
| Senegalese | 5.6 /100 | #219 | Tragic 2.3% |
| Immigrants | Costa Rica | 5.1 /100 | #220 | Tragic 2.3% |
| Immigrants | Sudan | 5.0 /100 | #221 | Tragic 2.3% |
| Sub-Saharan Africans | 4.7 /100 | #222 | Tragic 2.3% |
| Immigrants | Lebanon | 4.5 /100 | #223 | Tragic 2.3% |
| Tohono O'odham | 4.1 /100 | #224 | Tragic 2.3% |
| Sudanese | 4.1 /100 | #225 | Tragic 2.3% |
| Sierra Leoneans | 4.1 /100 | #226 | Tragic 2.3% |
| Immigrants | Uganda | 4.0 /100 | #227 | Tragic 2.3% |
| U.S. Virgin Islanders | 3.7 /100 | #228 | Tragic 2.3% |
| Immigrants | Pakistan | 3.6 /100 | #229 | Tragic 2.3% |
| Puerto Ricans | 3.4 /100 | #230 | Tragic 2.3% |
| Immigrants | Uruguay | 3.4 /100 | #231 | Tragic 2.3% |