Finnish vs Immigrants from Ghana No Schooling Completed
COMPARE
Finnish
Immigrants from Ghana
No Schooling Completed
No Schooling Completed Comparison
Finns
Immigrants from Ghana
1.5%
NO SCHOOLING COMPLETED
100.0/ 100
METRIC RATING
16th/ 347
METRIC RANK
2.6%
NO SCHOOLING COMPLETED
0.1/ 100
METRIC RATING
282nd/ 347
METRIC RANK
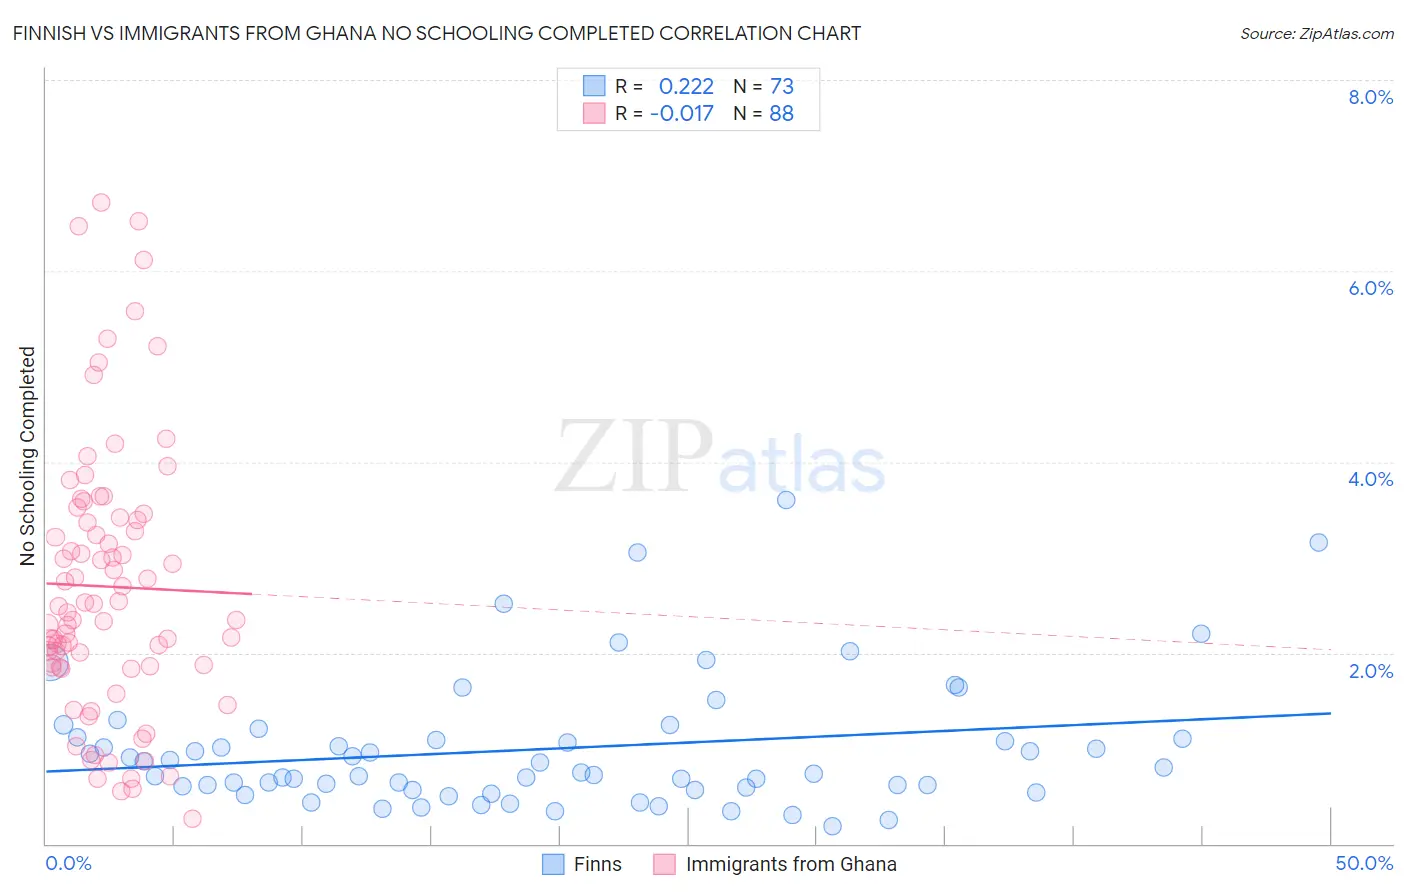
Finnish vs Immigrants from Ghana No Schooling Completed Correlation Chart
The statistical analysis conducted on geographies consisting of 398,073,835 people shows a weak positive correlation between the proportion of Finns and percentage of population with no schooling in the United States with a correlation coefficient (R) of 0.222 and weighted average of 1.5%. Similarly, the statistical analysis conducted on geographies consisting of 198,994,928 people shows no correlation between the proportion of Immigrants from Ghana and percentage of population with no schooling in the United States with a correlation coefficient (R) of -0.017 and weighted average of 2.6%, a difference of 78.5%.
No Schooling Completed Correlation Summary
| Measurement | Finnish | Immigrants from Ghana |
| Minimum | 0.18% | 0.26% |
| Maximum | 3.6% | 6.7% |
| Range | 3.4% | 6.5% |
| Mean | 0.99% | 2.7% |
| Median | 0.75% | 2.5% |
| Interquartile 25% (IQ1) | 0.58% | 1.9% |
| Interquartile 75% (IQ3) | 1.1% | 3.4% |
| Interquartile Range (IQR) | 0.53% | 1.6% |
| Standard Deviation (Sample) | 0.68% | 1.4% |
| Standard Deviation (Population) | 0.68% | 1.4% |
Similar Demographics by No Schooling Completed
Demographics Similar to Finns by No Schooling Completed
In terms of no schooling completed, the demographic groups most similar to Finns are Croatian (1.5%, a difference of 0.010%), Danish (1.5%, a difference of 0.31%), Alaskan Athabascan (1.5%, a difference of 0.42%), Tlingit-Haida (1.5%, a difference of 0.52%), and Welsh (1.5%, a difference of 0.54%).
| Demographics | Rating | Rank | No Schooling Completed |
| Scottish | 100.0 /100 | #9 | Exceptional 1.4% |
| Dutch | 100.0 /100 | #10 | Exceptional 1.4% |
| Lithuanians | 100.0 /100 | #11 | Exceptional 1.4% |
| Irish | 100.0 /100 | #12 | Exceptional 1.4% |
| Poles | 100.0 /100 | #13 | Exceptional 1.4% |
| Scotch-Irish | 100.0 /100 | #14 | Exceptional 1.5% |
| Tlingit-Haida | 100.0 /100 | #15 | Exceptional 1.5% |
| Finns | 100.0 /100 | #16 | Exceptional 1.5% |
| Croatians | 100.0 /100 | #17 | Exceptional 1.5% |
| Danes | 100.0 /100 | #18 | Exceptional 1.5% |
| Alaskan Athabascans | 100.0 /100 | #19 | Exceptional 1.5% |
| Welsh | 100.0 /100 | #20 | Exceptional 1.5% |
| Chinese | 100.0 /100 | #21 | Exceptional 1.5% |
| Alaska Natives | 100.0 /100 | #22 | Exceptional 1.5% |
| Europeans | 100.0 /100 | #23 | Exceptional 1.5% |
Demographics Similar to Immigrants from Ghana by No Schooling Completed
In terms of no schooling completed, the demographic groups most similar to Immigrants from Ghana are Afghan (2.6%, a difference of 0.20%), Trinidadian and Tobagonian (2.6%, a difference of 0.28%), Barbadian (2.6%, a difference of 0.30%), Immigrants from Uzbekistan (2.6%, a difference of 0.85%), and Immigrants from Philippines (2.6%, a difference of 1.1%).
| Demographics | Rating | Rank | No Schooling Completed |
| Immigrants | China | 0.1 /100 | #275 | Tragic 2.6% |
| Immigrants | Western Africa | 0.1 /100 | #276 | Tragic 2.6% |
| Immigrants | Philippines | 0.1 /100 | #277 | Tragic 2.6% |
| Immigrants | Uzbekistan | 0.1 /100 | #278 | Tragic 2.6% |
| Barbadians | 0.1 /100 | #279 | Tragic 2.6% |
| Trinidadians and Tobagonians | 0.1 /100 | #280 | Tragic 2.6% |
| Afghans | 0.1 /100 | #281 | Tragic 2.6% |
| Immigrants | Ghana | 0.1 /100 | #282 | Tragic 2.6% |
| Immigrants | Trinidad and Tobago | 0.0 /100 | #283 | Tragic 2.6% |
| Immigrants | West Indies | 0.0 /100 | #284 | Tragic 2.7% |
| Immigrants | Barbados | 0.0 /100 | #285 | Tragic 2.7% |
| Immigrants | Portugal | 0.0 /100 | #286 | Tragic 2.7% |
| Immigrants | Afghanistan | 0.0 /100 | #287 | Tragic 2.7% |
| Immigrants | St. Vincent and the Grenadines | 0.0 /100 | #288 | Tragic 2.7% |
| Immigrants | Thailand | 0.0 /100 | #289 | Tragic 2.7% |