Fijian vs Immigrants from Armenia College, Under 1 year
COMPARE
Fijian
Immigrants from Armenia
College, Under 1 year
College, Under 1 year Comparison
Fijians
Immigrants from Armenia
57.7%
COLLEGE, UNDER 1 YEAR
0.0/ 100
METRIC RATING
307th/ 347
METRIC RANK
64.7%
COLLEGE, UNDER 1 YEAR
28.1/ 100
METRIC RATING
191st/ 347
METRIC RANK
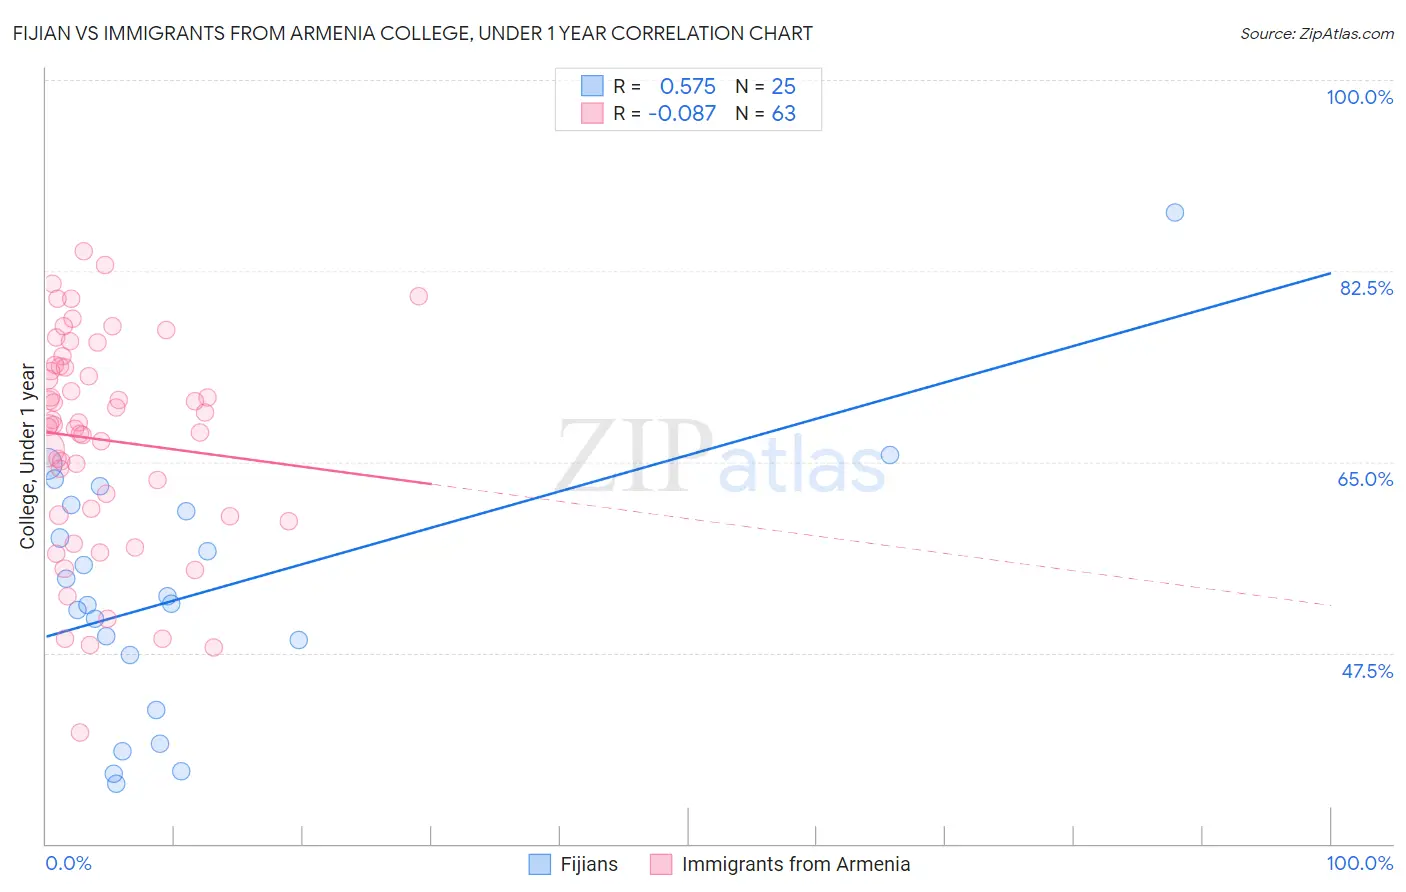
Fijian vs Immigrants from Armenia College, Under 1 year Correlation Chart
The statistical analysis conducted on geographies consisting of 55,948,842 people shows a substantial positive correlation between the proportion of Fijians and percentage of population with at least college, under 1 year education in the United States with a correlation coefficient (R) of 0.575 and weighted average of 57.7%. Similarly, the statistical analysis conducted on geographies consisting of 97,725,183 people shows a slight negative correlation between the proportion of Immigrants from Armenia and percentage of population with at least college, under 1 year education in the United States with a correlation coefficient (R) of -0.087 and weighted average of 64.7%, a difference of 12.3%.
College, Under 1 year Correlation Summary
| Measurement | Fijian | Immigrants from Armenia |
| Minimum | 35.5% | 40.2% |
| Maximum | 87.8% | 84.3% |
| Range | 52.4% | 44.1% |
| Mean | 52.9% | 67.0% |
| Median | 52.0% | 68.4% |
| Interquartile 25% (IQ1) | 44.7% | 60.1% |
| Interquartile 75% (IQ3) | 60.7% | 73.8% |
| Interquartile Range (IQR) | 16.0% | 13.6% |
| Standard Deviation (Sample) | 11.8% | 9.7% |
| Standard Deviation (Population) | 11.5% | 9.7% |
Similar Demographics by College, Under 1 year
Demographics Similar to Fijians by College, Under 1 year
In terms of college, under 1 year, the demographic groups most similar to Fijians are Central American (57.7%, a difference of 0.0%), Immigrants from Portugal (57.7%, a difference of 0.010%), Immigrants from Nicaragua (57.6%, a difference of 0.12%), Haitian (57.8%, a difference of 0.21%), and Kiowa (57.8%, a difference of 0.32%).
| Demographics | Rating | Rank | College, Under 1 year |
| Immigrants | Guyana | 0.0 /100 | #300 | Tragic 58.5% |
| Mexican American Indians | 0.0 /100 | #301 | Tragic 58.1% |
| Apache | 0.0 /100 | #302 | Tragic 58.0% |
| Immigrants | Dominica | 0.0 /100 | #303 | Tragic 57.9% |
| Kiowa | 0.0 /100 | #304 | Tragic 57.8% |
| Haitians | 0.0 /100 | #305 | Tragic 57.8% |
| Immigrants | Portugal | 0.0 /100 | #306 | Tragic 57.7% |
| Fijians | 0.0 /100 | #307 | Tragic 57.7% |
| Central Americans | 0.0 /100 | #308 | Tragic 57.7% |
| Immigrants | Nicaragua | 0.0 /100 | #309 | Tragic 57.6% |
| Pueblo | 0.0 /100 | #310 | Tragic 57.4% |
| Cajuns | 0.0 /100 | #311 | Tragic 57.3% |
| Salvadorans | 0.0 /100 | #312 | Tragic 57.3% |
| Dutch West Indians | 0.0 /100 | #313 | Tragic 57.2% |
| Hopi | 0.0 /100 | #314 | Tragic 57.1% |
Demographics Similar to Immigrants from Armenia by College, Under 1 year
In terms of college, under 1 year, the demographic groups most similar to Immigrants from Armenia are Immigrants from Thailand (64.7%, a difference of 0.060%), Slovak (64.7%, a difference of 0.070%), Immigrants from Philippines (64.8%, a difference of 0.11%), Spanish (64.9%, a difference of 0.19%), and Immigrants from Cameroon (64.6%, a difference of 0.20%).
| Demographics | Rating | Rank | College, Under 1 year |
| Bermudans | 42.0 /100 | #184 | Average 65.2% |
| Sri Lankans | 41.7 /100 | #185 | Average 65.2% |
| Immigrants | Sierra Leone | 39.7 /100 | #186 | Fair 65.1% |
| Immigrants | Southern Europe | 34.3 /100 | #187 | Fair 64.9% |
| Immigrants | Albania | 32.0 /100 | #188 | Fair 64.9% |
| Spanish | 31.6 /100 | #189 | Fair 64.9% |
| Immigrants | Philippines | 30.1 /100 | #190 | Fair 64.8% |
| Immigrants | Armenia | 28.1 /100 | #191 | Fair 64.7% |
| Immigrants | Thailand | 27.0 /100 | #192 | Fair 64.7% |
| Slovaks | 26.7 /100 | #193 | Fair 64.7% |
| Immigrants | Cameroon | 24.6 /100 | #194 | Fair 64.6% |
| Immigrants | South Eastern Asia | 22.1 /100 | #195 | Fair 64.5% |
| Tongans | 21.2 /100 | #196 | Fair 64.5% |
| Costa Ricans | 19.6 /100 | #197 | Poor 64.4% |
| Tsimshian | 17.9 /100 | #198 | Poor 64.3% |