Fijian vs Creek College, Under 1 year
COMPARE
Fijian
Creek
College, Under 1 year
College, Under 1 year Comparison
Fijians
Creek
57.7%
COLLEGE, UNDER 1 YEAR
0.0/ 100
METRIC RATING
307th/ 347
METRIC RANK
59.3%
COLLEGE, UNDER 1 YEAR
0.0/ 100
METRIC RATING
291st/ 347
METRIC RANK
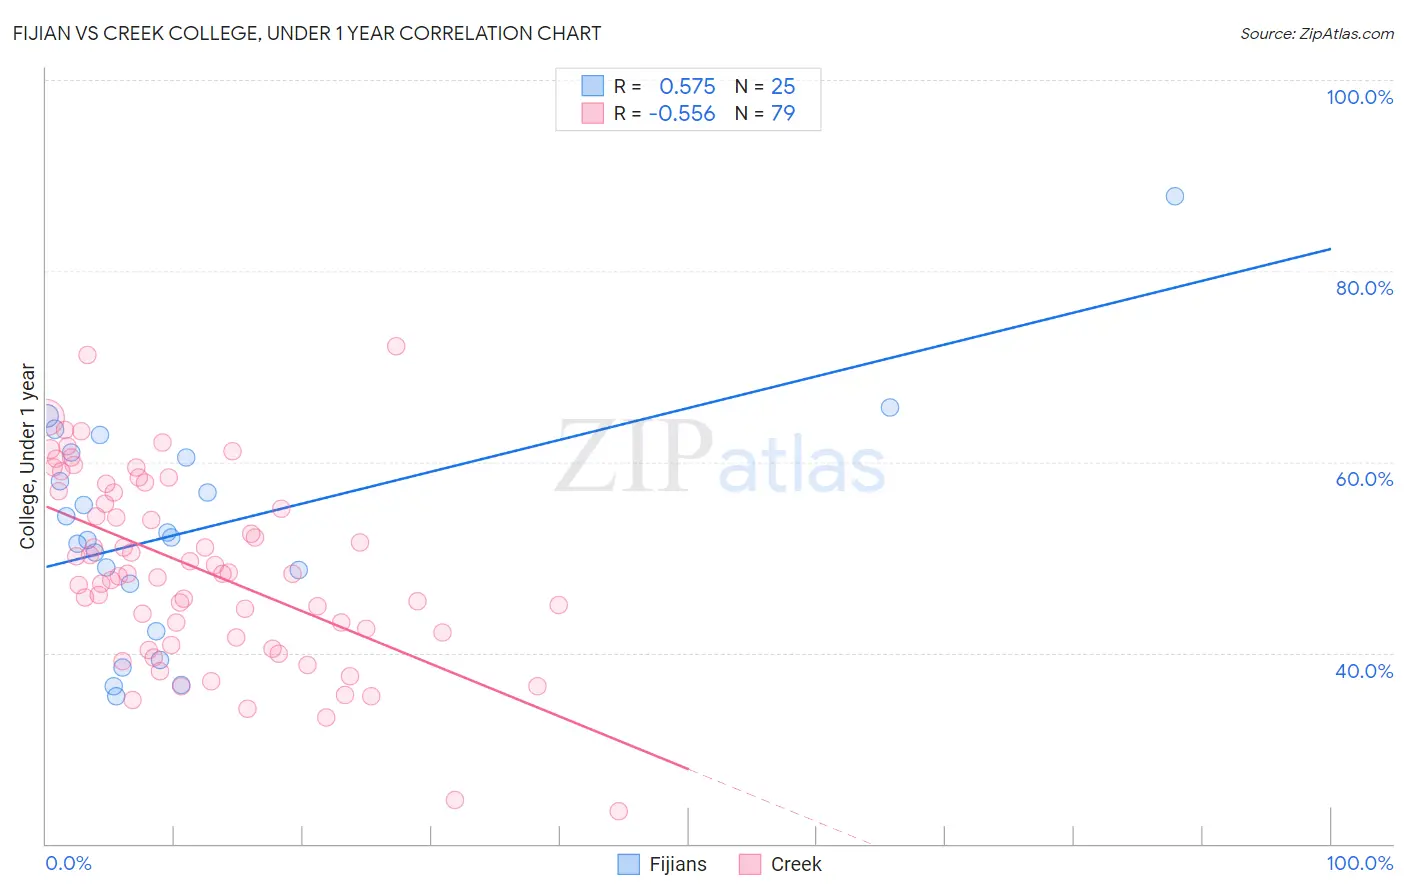
Fijian vs Creek College, Under 1 year Correlation Chart
The statistical analysis conducted on geographies consisting of 55,948,842 people shows a substantial positive correlation between the proportion of Fijians and percentage of population with at least college, under 1 year education in the United States with a correlation coefficient (R) of 0.575 and weighted average of 57.7%. Similarly, the statistical analysis conducted on geographies consisting of 178,480,346 people shows a substantial negative correlation between the proportion of Creek and percentage of population with at least college, under 1 year education in the United States with a correlation coefficient (R) of -0.556 and weighted average of 59.3%, a difference of 2.8%.
College, Under 1 year Correlation Summary
| Measurement | Fijian | Creek |
| Minimum | 35.5% | 23.4% |
| Maximum | 87.8% | 72.1% |
| Range | 52.4% | 48.7% |
| Mean | 52.9% | 48.8% |
| Median | 52.0% | 48.2% |
| Interquartile 25% (IQ1) | 44.7% | 41.6% |
| Interquartile 75% (IQ3) | 60.7% | 57.0% |
| Interquartile Range (IQR) | 16.0% | 15.4% |
| Standard Deviation (Sample) | 11.8% | 9.9% |
| Standard Deviation (Population) | 11.5% | 9.8% |
Demographics Similar to Fijians and Creek by College, Under 1 year
In terms of college, under 1 year, the demographic groups most similar to Fijians are Central American (57.7%, a difference of 0.0%), Immigrants from Portugal (57.7%, a difference of 0.010%), Immigrants from Nicaragua (57.6%, a difference of 0.12%), Haitian (57.8%, a difference of 0.21%), and Kiowa (57.8%, a difference of 0.32%). Similarly, the demographic groups most similar to Creek are Nicaraguan (59.2%, a difference of 0.040%), Ecuadorian (59.3%, a difference of 0.090%), Choctaw (59.3%, a difference of 0.13%), Seminole (59.1%, a difference of 0.23%), and Immigrants from Belize (59.1%, a difference of 0.24%).
| Demographics | Rating | Rank | College, Under 1 year |
| Choctaw | 0.0 /100 | #289 | Tragic 59.3% |
| Ecuadorians | 0.0 /100 | #290 | Tragic 59.3% |
| Creek | 0.0 /100 | #291 | Tragic 59.3% |
| Nicaraguans | 0.0 /100 | #292 | Tragic 59.2% |
| Seminole | 0.0 /100 | #293 | Tragic 59.1% |
| Immigrants | Belize | 0.0 /100 | #294 | Tragic 59.1% |
| Immigrants | Grenada | 0.0 /100 | #295 | Tragic 59.1% |
| Central American Indians | 0.0 /100 | #296 | Tragic 59.0% |
| Guyanese | 0.0 /100 | #297 | Tragic 59.0% |
| Immigrants | Ecuador | 0.0 /100 | #298 | Tragic 58.7% |
| Cubans | 0.0 /100 | #299 | Tragic 58.6% |
| Immigrants | Guyana | 0.0 /100 | #300 | Tragic 58.5% |
| Mexican American Indians | 0.0 /100 | #301 | Tragic 58.1% |
| Apache | 0.0 /100 | #302 | Tragic 58.0% |
| Immigrants | Dominica | 0.0 /100 | #303 | Tragic 57.9% |
| Kiowa | 0.0 /100 | #304 | Tragic 57.8% |
| Haitians | 0.0 /100 | #305 | Tragic 57.8% |
| Immigrants | Portugal | 0.0 /100 | #306 | Tragic 57.7% |
| Fijians | 0.0 /100 | #307 | Tragic 57.7% |
| Central Americans | 0.0 /100 | #308 | Tragic 57.7% |
| Immigrants | Nicaragua | 0.0 /100 | #309 | Tragic 57.6% |