Hispanic or Latino vs Welsh No Schooling Completed
COMPARE
Hispanic or Latino
Welsh
No Schooling Completed
No Schooling Completed Comparison
Hispanics or Latinos
Welsh
3.0%
NO SCHOOLING COMPLETED
0.0/ 100
METRIC RATING
309th/ 347
METRIC RANK
1.5%
NO SCHOOLING COMPLETED
100.0/ 100
METRIC RATING
20th/ 347
METRIC RANK
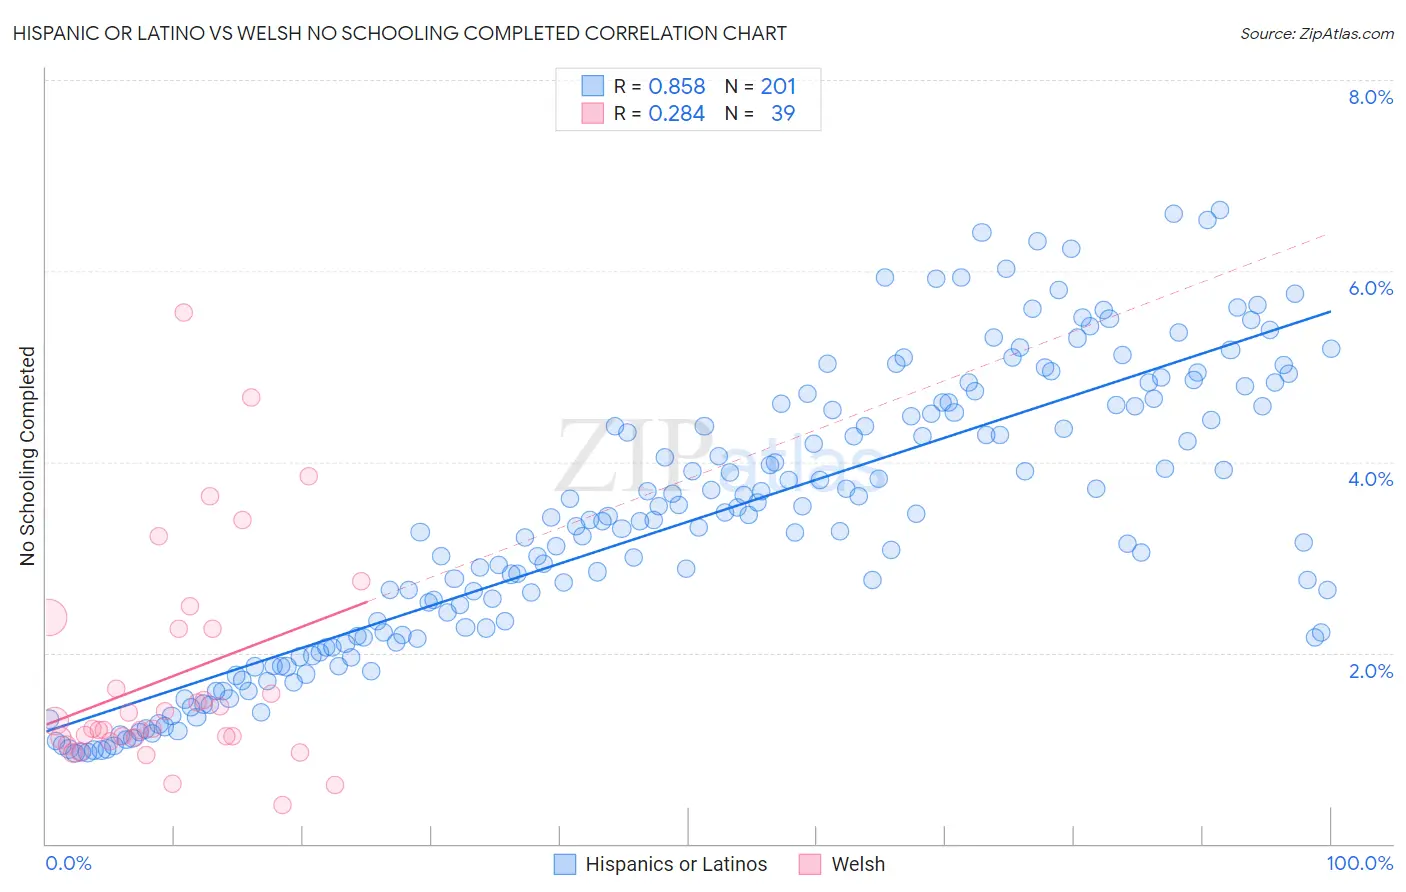
Hispanic or Latino vs Welsh No Schooling Completed Correlation Chart
The statistical analysis conducted on geographies consisting of 559,472,816 people shows a very strong positive correlation between the proportion of Hispanics or Latinos and percentage of population with no schooling in the United States with a correlation coefficient (R) of 0.858 and weighted average of 3.0%. Similarly, the statistical analysis conducted on geographies consisting of 514,712,087 people shows a weak positive correlation between the proportion of Welsh and percentage of population with no schooling in the United States with a correlation coefficient (R) of 0.284 and weighted average of 1.5%, a difference of 106.8%.
No Schooling Completed Correlation Summary
| Measurement | Hispanic or Latino | Welsh |
| Minimum | 0.95% | 0.40% |
| Maximum | 6.6% | 5.6% |
| Range | 5.7% | 5.2% |
| Mean | 3.4% | 1.8% |
| Median | 3.4% | 1.2% |
| Interquartile 25% (IQ1) | 2.1% | 1.1% |
| Interquartile 75% (IQ3) | 4.6% | 2.2% |
| Interquartile Range (IQR) | 2.5% | 1.1% |
| Standard Deviation (Sample) | 1.5% | 1.2% |
| Standard Deviation (Population) | 1.5% | 1.1% |
Similar Demographics by No Schooling Completed
Demographics Similar to Hispanics or Latinos by No Schooling Completed
In terms of no schooling completed, the demographic groups most similar to Hispanics or Latinos are Guyanese (3.0%, a difference of 0.050%), Immigrants from the Azores (3.0%, a difference of 0.15%), Sri Lankan (3.0%, a difference of 0.43%), Immigrants from Somalia (3.0%, a difference of 0.81%), and Honduran (3.1%, a difference of 0.94%).
| Demographics | Rating | Rank | No Schooling Completed |
| Immigrants | Caribbean | 0.0 /100 | #302 | Tragic 2.9% |
| Somalis | 0.0 /100 | #303 | Tragic 2.9% |
| Nicaraguans | 0.0 /100 | #304 | Tragic 2.9% |
| Ecuadorians | 0.0 /100 | #305 | Tragic 3.0% |
| Belizeans | 0.0 /100 | #306 | Tragic 3.0% |
| Immigrants | Haiti | 0.0 /100 | #307 | Tragic 3.0% |
| Immigrants | Somalia | 0.0 /100 | #308 | Tragic 3.0% |
| Hispanics or Latinos | 0.0 /100 | #309 | Tragic 3.0% |
| Guyanese | 0.0 /100 | #310 | Tragic 3.0% |
| Immigrants | Azores | 0.0 /100 | #311 | Tragic 3.0% |
| Sri Lankans | 0.0 /100 | #312 | Tragic 3.0% |
| Hondurans | 0.0 /100 | #313 | Tragic 3.1% |
| Immigrants | Belize | 0.0 /100 | #314 | Tragic 3.1% |
| Immigrants | Nicaragua | 0.0 /100 | #315 | Tragic 3.1% |
| Immigrants | Ecuador | 0.0 /100 | #316 | Tragic 3.1% |
Demographics Similar to Welsh by No Schooling Completed
In terms of no schooling completed, the demographic groups most similar to Welsh are Alaskan Athabascan (1.5%, a difference of 0.13%), Danish (1.5%, a difference of 0.23%), Chinese (1.5%, a difference of 0.37%), Alaska Native (1.5%, a difference of 0.46%), and Croatian (1.5%, a difference of 0.53%).
| Demographics | Rating | Rank | No Schooling Completed |
| Poles | 100.0 /100 | #13 | Exceptional 1.4% |
| Scotch-Irish | 100.0 /100 | #14 | Exceptional 1.5% |
| Tlingit-Haida | 100.0 /100 | #15 | Exceptional 1.5% |
| Finns | 100.0 /100 | #16 | Exceptional 1.5% |
| Croatians | 100.0 /100 | #17 | Exceptional 1.5% |
| Danes | 100.0 /100 | #18 | Exceptional 1.5% |
| Alaskan Athabascans | 100.0 /100 | #19 | Exceptional 1.5% |
| Welsh | 100.0 /100 | #20 | Exceptional 1.5% |
| Chinese | 100.0 /100 | #21 | Exceptional 1.5% |
| Alaska Natives | 100.0 /100 | #22 | Exceptional 1.5% |
| Europeans | 100.0 /100 | #23 | Exceptional 1.5% |
| Pennsylvania Germans | 100.0 /100 | #24 | Exceptional 1.5% |
| French | 100.0 /100 | #25 | Exceptional 1.5% |
| Czechs | 100.0 /100 | #26 | Exceptional 1.5% |
| Scandinavians | 100.0 /100 | #27 | Exceptional 1.5% |