Ethiopian vs Kenyan GED/Equivalency
COMPARE
Ethiopian
Kenyan
GED/Equivalency
GED/Equivalency Comparison
Ethiopians
Kenyans
86.0%
GED/EQUIVALENCY
63.7/ 100
METRIC RATING
167th/ 347
METRIC RANK
86.3%
GED/EQUIVALENCY
76.6/ 100
METRIC RATING
153rd/ 347
METRIC RANK
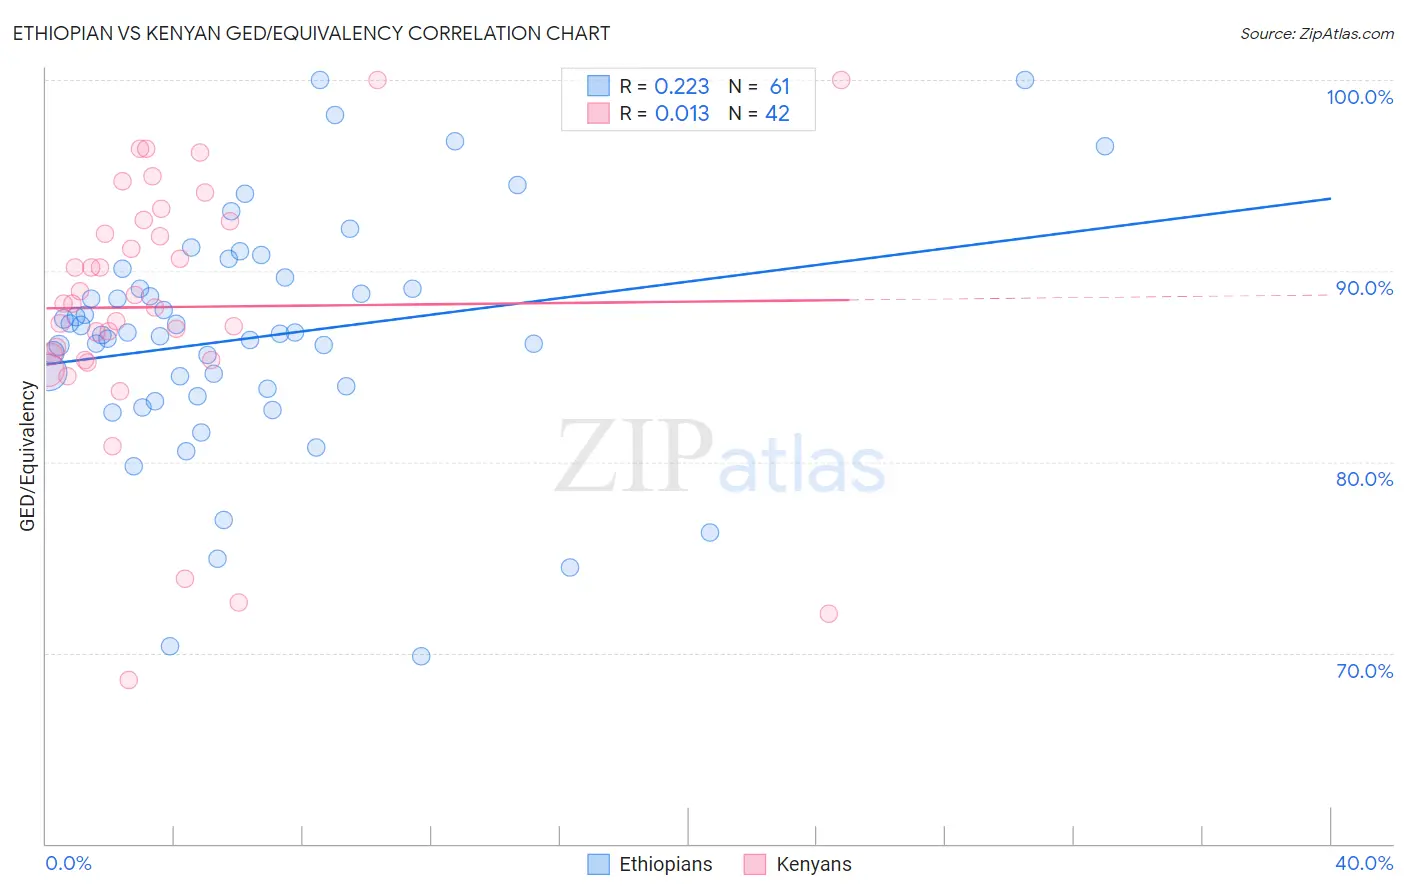
Ethiopian vs Kenyan GED/Equivalency Correlation Chart
The statistical analysis conducted on geographies consisting of 223,262,051 people shows a weak positive correlation between the proportion of Ethiopians and percentage of population with at least ged/equivalency education in the United States with a correlation coefficient (R) of 0.223 and weighted average of 86.0%. Similarly, the statistical analysis conducted on geographies consisting of 168,244,481 people shows no correlation between the proportion of Kenyans and percentage of population with at least ged/equivalency education in the United States with a correlation coefficient (R) of 0.013 and weighted average of 86.3%, a difference of 0.32%.
GED/Equivalency Correlation Summary
| Measurement | Ethiopian | Kenyan |
| Minimum | 69.8% | 68.6% |
| Maximum | 100.0% | 100.0% |
| Range | 30.2% | 31.4% |
| Mean | 86.5% | 88.1% |
| Median | 86.7% | 88.3% |
| Interquartile 25% (IQ1) | 83.6% | 85.3% |
| Interquartile 75% (IQ3) | 89.4% | 92.6% |
| Interquartile Range (IQR) | 5.7% | 7.3% |
| Standard Deviation (Sample) | 6.2% | 6.9% |
| Standard Deviation (Population) | 6.1% | 6.8% |
Demographics Similar to Ethiopians and Kenyans by GED/Equivalency
In terms of ged/equivalency, the demographic groups most similar to Ethiopians are Alsatian (86.0%, a difference of 0.010%), Immigrants from Albania (86.0%, a difference of 0.010%), Venezuelan (86.0%, a difference of 0.040%), Sierra Leonean (86.0%, a difference of 0.040%), and Immigrants from Ethiopia (86.0%, a difference of 0.050%). Similarly, the demographic groups most similar to Kenyans are Armenian (86.3%, a difference of 0.0%), Brazilian (86.3%, a difference of 0.020%), Immigrants from Bosnia and Herzegovina (86.3%, a difference of 0.040%), Iraqi (86.2%, a difference of 0.040%), and Immigrants from Western Asia (86.3%, a difference of 0.070%).
| Demographics | Rating | Rank | GED/Equivalency |
| Immigrants | Western Asia | 78.8 /100 | #150 | Good 86.3% |
| Immigrants | Bosnia and Herzegovina | 77.9 /100 | #151 | Good 86.3% |
| Brazilians | 77.2 /100 | #152 | Good 86.3% |
| Kenyans | 76.6 /100 | #153 | Good 86.3% |
| Armenians | 76.4 /100 | #154 | Good 86.3% |
| Iraqis | 75.2 /100 | #155 | Good 86.2% |
| Immigrants | Nepal | 73.3 /100 | #156 | Good 86.2% |
| Whites/Caucasians | 72.2 /100 | #157 | Good 86.2% |
| German Russians | 72.1 /100 | #158 | Good 86.2% |
| Immigrants | Kenya | 71.8 /100 | #159 | Good 86.2% |
| Immigrants | Morocco | 69.5 /100 | #160 | Good 86.1% |
| Immigrants | Syria | 69.3 /100 | #161 | Good 86.1% |
| Immigrants | Iraq | 68.1 /100 | #162 | Good 86.1% |
| Ugandans | 66.3 /100 | #163 | Good 86.1% |
| Venezuelans | 65.5 /100 | #164 | Good 86.0% |
| Alsatians | 64.3 /100 | #165 | Good 86.0% |
| Immigrants | Albania | 64.2 /100 | #166 | Good 86.0% |
| Ethiopians | 63.7 /100 | #167 | Good 86.0% |
| Sierra Leoneans | 61.8 /100 | #168 | Good 86.0% |
| Immigrants | Ethiopia | 61.2 /100 | #169 | Good 86.0% |
| Afghans | 59.7 /100 | #170 | Average 85.9% |