Ethiopian vs Kenyan Unemployment Among Women with Children Ages 6 to 17 years
COMPARE
Ethiopian
Kenyan
Unemployment Among Women with Children Ages 6 to 17 years
Unemployment Among Women with Children Ages 6 to 17 years Comparison
Ethiopians
Kenyans
9.0%
UNEMPLOYMENT AMONG WOMEN WITH CHILDREN AGES 6 TO 17 YEARS
37.6/ 100
METRIC RATING
180th/ 347
METRIC RANK
8.8%
UNEMPLOYMENT AMONG WOMEN WITH CHILDREN AGES 6 TO 17 YEARS
85.6/ 100
METRIC RATING
145th/ 347
METRIC RANK
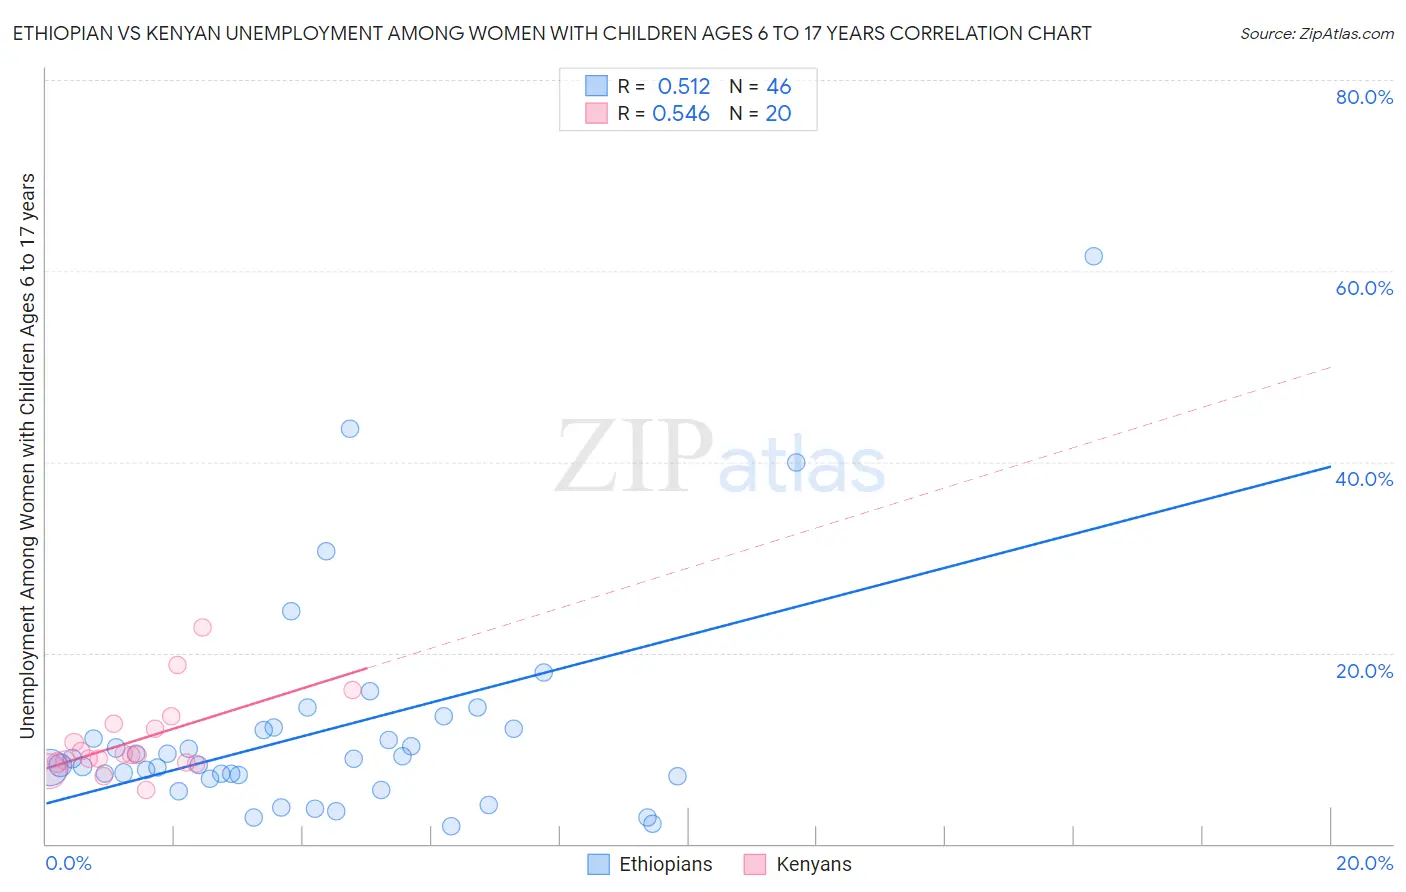
Ethiopian vs Kenyan Unemployment Among Women with Children Ages 6 to 17 years Correlation Chart
The statistical analysis conducted on geographies consisting of 181,219,006 people shows a substantial positive correlation between the proportion of Ethiopians and unemployment rate among women with children between the ages 6 and 17 in the United States with a correlation coefficient (R) of 0.512 and weighted average of 9.0%. Similarly, the statistical analysis conducted on geographies consisting of 141,527,073 people shows a substantial positive correlation between the proportion of Kenyans and unemployment rate among women with children between the ages 6 and 17 in the United States with a correlation coefficient (R) of 0.546 and weighted average of 8.8%, a difference of 2.6%.
Unemployment Among Women with Children Ages 6 to 17 years Correlation Summary
| Measurement | Ethiopian | Kenyan |
| Minimum | 1.8% | 5.6% |
| Maximum | 61.5% | 22.7% |
| Range | 59.7% | 17.1% |
| Mean | 11.8% | 10.8% |
| Median | 8.6% | 9.3% |
| Interquartile 25% (IQ1) | 7.1% | 8.5% |
| Interquartile 75% (IQ3) | 12.0% | 12.3% |
| Interquartile Range (IQR) | 4.9% | 3.9% |
| Standard Deviation (Sample) | 11.4% | 4.2% |
| Standard Deviation (Population) | 11.2% | 4.1% |
Similar Demographics by Unemployment Among Women with Children Ages 6 to 17 years
Demographics Similar to Ethiopians by Unemployment Among Women with Children Ages 6 to 17 years
In terms of unemployment among women with children ages 6 to 17 years, the demographic groups most similar to Ethiopians are Immigrants from Zaire (9.0%, a difference of 0.030%), Menominee (9.0%, a difference of 0.080%), Immigrants from Czechoslovakia (9.0%, a difference of 0.15%), South American Indian (9.0%, a difference of 0.16%), and Immigrants from Jordan (9.0%, a difference of 0.18%).
| Demographics | Rating | Rank | Unemployment Among Women with Children Ages 6 to 17 years |
| Immigrants | Brazil | 51.0 /100 | #173 | Average 9.0% |
| Immigrants | Costa Rica | 50.0 /100 | #174 | Average 9.0% |
| Immigrants | Sierra Leone | 45.9 /100 | #175 | Average 9.0% |
| Immigrants | Italy | 43.7 /100 | #176 | Average 9.0% |
| Immigrants | Jordan | 41.6 /100 | #177 | Average 9.0% |
| Menominee | 39.3 /100 | #178 | Fair 9.0% |
| Immigrants | Zaire | 38.3 /100 | #179 | Fair 9.0% |
| Ethiopians | 37.6 /100 | #180 | Fair 9.0% |
| Immigrants | Czechoslovakia | 34.5 /100 | #181 | Fair 9.0% |
| South American Indians | 34.4 /100 | #182 | Fair 9.0% |
| Swiss | 33.5 /100 | #183 | Fair 9.0% |
| Palestinians | 33.4 /100 | #184 | Fair 9.0% |
| Immigrants | Congo | 32.5 /100 | #185 | Fair 9.0% |
| Immigrants | Spain | 32.4 /100 | #186 | Fair 9.0% |
| Comanche | 30.0 /100 | #187 | Fair 9.0% |
Demographics Similar to Kenyans by Unemployment Among Women with Children Ages 6 to 17 years
In terms of unemployment among women with children ages 6 to 17 years, the demographic groups most similar to Kenyans are Russian (8.8%, a difference of 0.020%), Immigrants from Kenya (8.8%, a difference of 0.050%), Immigrants from Austria (8.8%, a difference of 0.18%), Serbian (8.8%, a difference of 0.20%), and Immigrants from Poland (8.8%, a difference of 0.26%).
| Demographics | Rating | Rank | Unemployment Among Women with Children Ages 6 to 17 years |
| Immigrants | Ethiopia | 89.5 /100 | #138 | Excellent 8.8% |
| Northern Europeans | 89.2 /100 | #139 | Excellent 8.8% |
| Immigrants | Poland | 88.3 /100 | #140 | Excellent 8.8% |
| Serbians | 87.6 /100 | #141 | Excellent 8.8% |
| Immigrants | Austria | 87.5 /100 | #142 | Excellent 8.8% |
| Immigrants | Kenya | 86.1 /100 | #143 | Excellent 8.8% |
| Russians | 85.8 /100 | #144 | Excellent 8.8% |
| Kenyans | 85.6 /100 | #145 | Excellent 8.8% |
| Chileans | 80.8 /100 | #146 | Excellent 8.8% |
| Immigrants | Bangladesh | 79.4 /100 | #147 | Good 8.8% |
| Costa Ricans | 77.0 /100 | #148 | Good 8.8% |
| Croatians | 76.0 /100 | #149 | Good 8.8% |
| Greeks | 75.2 /100 | #150 | Good 8.9% |
| Immigrants | Eastern Africa | 74.6 /100 | #151 | Good 8.9% |
| Immigrants | Northern Europe | 74.6 /100 | #152 | Good 8.9% |