Ethiopian vs Immigrants from South Africa GED/Equivalency
COMPARE
Ethiopian
Immigrants from South Africa
GED/Equivalency
GED/Equivalency Comparison
Ethiopians
Immigrants from South Africa
86.0%
GED/EQUIVALENCY
63.7/ 100
METRIC RATING
167th/ 347
METRIC RANK
88.0%
GED/EQUIVALENCY
99.4/ 100
METRIC RATING
53rd/ 347
METRIC RANK
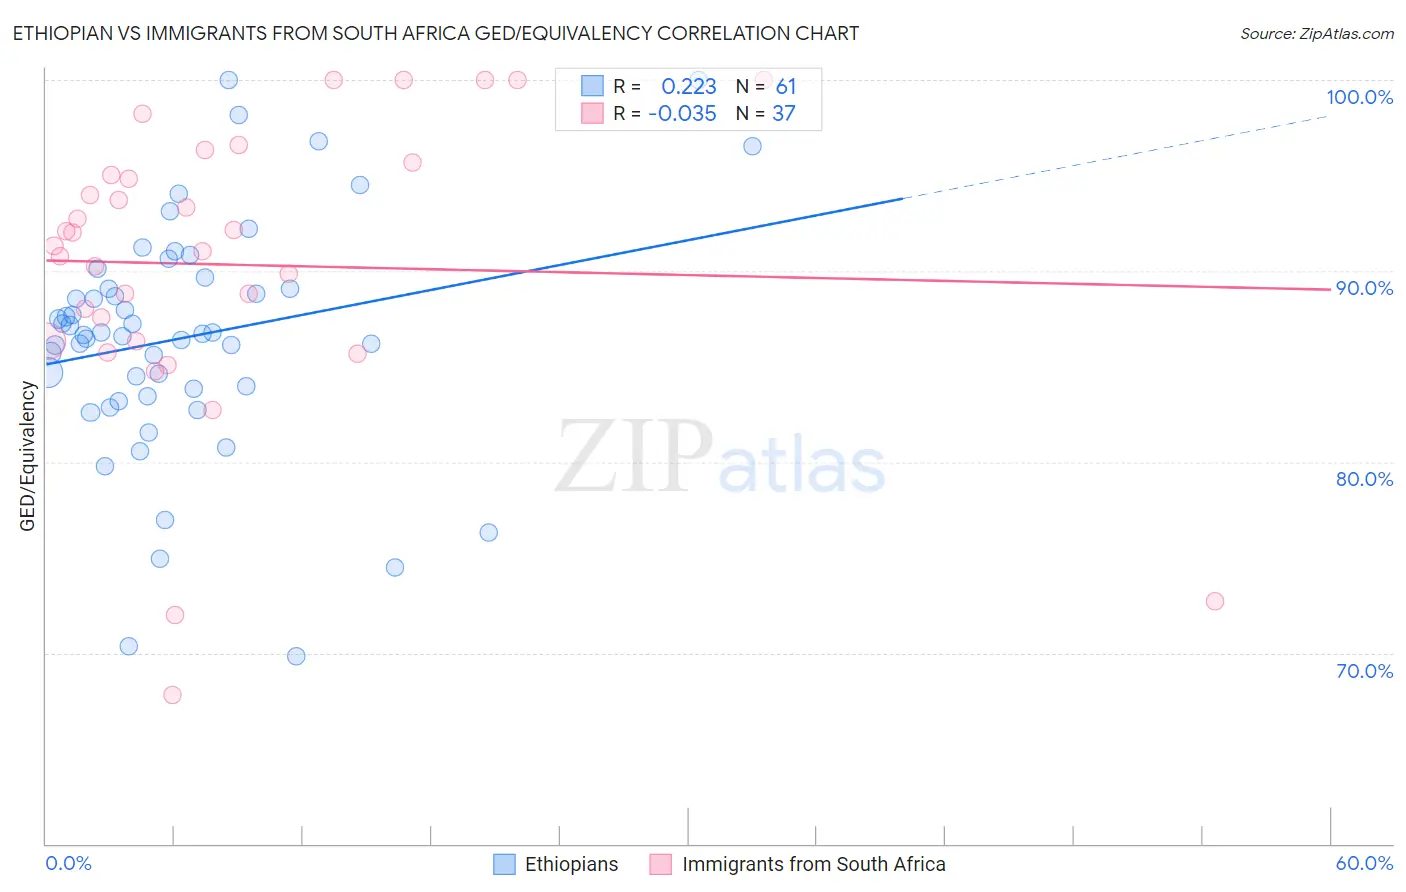
Ethiopian vs Immigrants from South Africa GED/Equivalency Correlation Chart
The statistical analysis conducted on geographies consisting of 223,262,051 people shows a weak positive correlation between the proportion of Ethiopians and percentage of population with at least ged/equivalency education in the United States with a correlation coefficient (R) of 0.223 and weighted average of 86.0%. Similarly, the statistical analysis conducted on geographies consisting of 233,321,845 people shows no correlation between the proportion of Immigrants from South Africa and percentage of population with at least ged/equivalency education in the United States with a correlation coefficient (R) of -0.035 and weighted average of 88.0%, a difference of 2.3%.
GED/Equivalency Correlation Summary
| Measurement | Ethiopian | Immigrants from South Africa |
| Minimum | 69.8% | 67.8% |
| Maximum | 100.0% | 100.0% |
| Range | 30.2% | 32.2% |
| Mean | 86.5% | 90.3% |
| Median | 86.7% | 91.3% |
| Interquartile 25% (IQ1) | 83.6% | 86.3% |
| Interquartile 75% (IQ3) | 89.4% | 95.4% |
| Interquartile Range (IQR) | 5.7% | 9.0% |
| Standard Deviation (Sample) | 6.2% | 7.6% |
| Standard Deviation (Population) | 6.1% | 7.5% |
Similar Demographics by GED/Equivalency
Demographics Similar to Ethiopians by GED/Equivalency
In terms of ged/equivalency, the demographic groups most similar to Ethiopians are Alsatian (86.0%, a difference of 0.010%), Immigrants from Albania (86.0%, a difference of 0.010%), Venezuelan (86.0%, a difference of 0.040%), Sierra Leonean (86.0%, a difference of 0.040%), and Immigrants from Ethiopia (86.0%, a difference of 0.050%).
| Demographics | Rating | Rank | GED/Equivalency |
| Immigrants | Morocco | 69.5 /100 | #160 | Good 86.1% |
| Immigrants | Syria | 69.3 /100 | #161 | Good 86.1% |
| Immigrants | Iraq | 68.1 /100 | #162 | Good 86.1% |
| Ugandans | 66.3 /100 | #163 | Good 86.1% |
| Venezuelans | 65.5 /100 | #164 | Good 86.0% |
| Alsatians | 64.3 /100 | #165 | Good 86.0% |
| Immigrants | Albania | 64.2 /100 | #166 | Good 86.0% |
| Ethiopians | 63.7 /100 | #167 | Good 86.0% |
| Sierra Leoneans | 61.8 /100 | #168 | Good 86.0% |
| Immigrants | Ethiopia | 61.2 /100 | #169 | Good 86.0% |
| Afghans | 59.7 /100 | #170 | Average 85.9% |
| Immigrants | Chile | 57.3 /100 | #171 | Average 85.9% |
| Bermudans | 55.1 /100 | #172 | Average 85.8% |
| Immigrants | Venezuela | 50.7 /100 | #173 | Average 85.8% |
| Ottawa | 50.0 /100 | #174 | Average 85.8% |
Demographics Similar to Immigrants from South Africa by GED/Equivalency
In terms of ged/equivalency, the demographic groups most similar to Immigrants from South Africa are Immigrants from Netherlands (88.0%, a difference of 0.0%), Zimbabwean (88.0%, a difference of 0.0%), Soviet Union (88.0%, a difference of 0.010%), New Zealander (88.0%, a difference of 0.010%), and Immigrants from Denmark (88.0%, a difference of 0.030%).
| Demographics | Rating | Rank | GED/Equivalency |
| Immigrants | Switzerland | 99.5 /100 | #46 | Exceptional 88.1% |
| Immigrants | Latvia | 99.5 /100 | #47 | Exceptional 88.1% |
| Greeks | 99.5 /100 | #48 | Exceptional 88.1% |
| Australians | 99.5 /100 | #49 | Exceptional 88.1% |
| Immigrants | Korea | 99.5 /100 | #50 | Exceptional 88.1% |
| Immigrants | Netherlands | 99.4 /100 | #51 | Exceptional 88.0% |
| Zimbabweans | 99.4 /100 | #52 | Exceptional 88.0% |
| Immigrants | South Africa | 99.4 /100 | #53 | Exceptional 88.0% |
| Soviet Union | 99.4 /100 | #54 | Exceptional 88.0% |
| New Zealanders | 99.4 /100 | #55 | Exceptional 88.0% |
| Immigrants | Denmark | 99.4 /100 | #56 | Exceptional 88.0% |
| Immigrants | Czechoslovakia | 99.3 /100 | #57 | Exceptional 87.9% |
| Northern Europeans | 99.3 /100 | #58 | Exceptional 87.9% |
| Serbians | 99.3 /100 | #59 | Exceptional 87.9% |
| Scandinavians | 99.3 /100 | #60 | Exceptional 87.9% |