Ethiopian vs Kenyan Child Poverty Under the Age of 5
COMPARE
Ethiopian
Kenyan
Child Poverty Under the Age of 5
Child Poverty Under the Age of 5 Comparison
Ethiopians
Kenyans
16.5%
CHILD POVERTY UNDER THE AGE OF 5
82.7/ 100
METRIC RATING
144th/ 347
METRIC RANK
17.5%
CHILD POVERTY UNDER THE AGE OF 5
34.7/ 100
METRIC RATING
187th/ 347
METRIC RANK
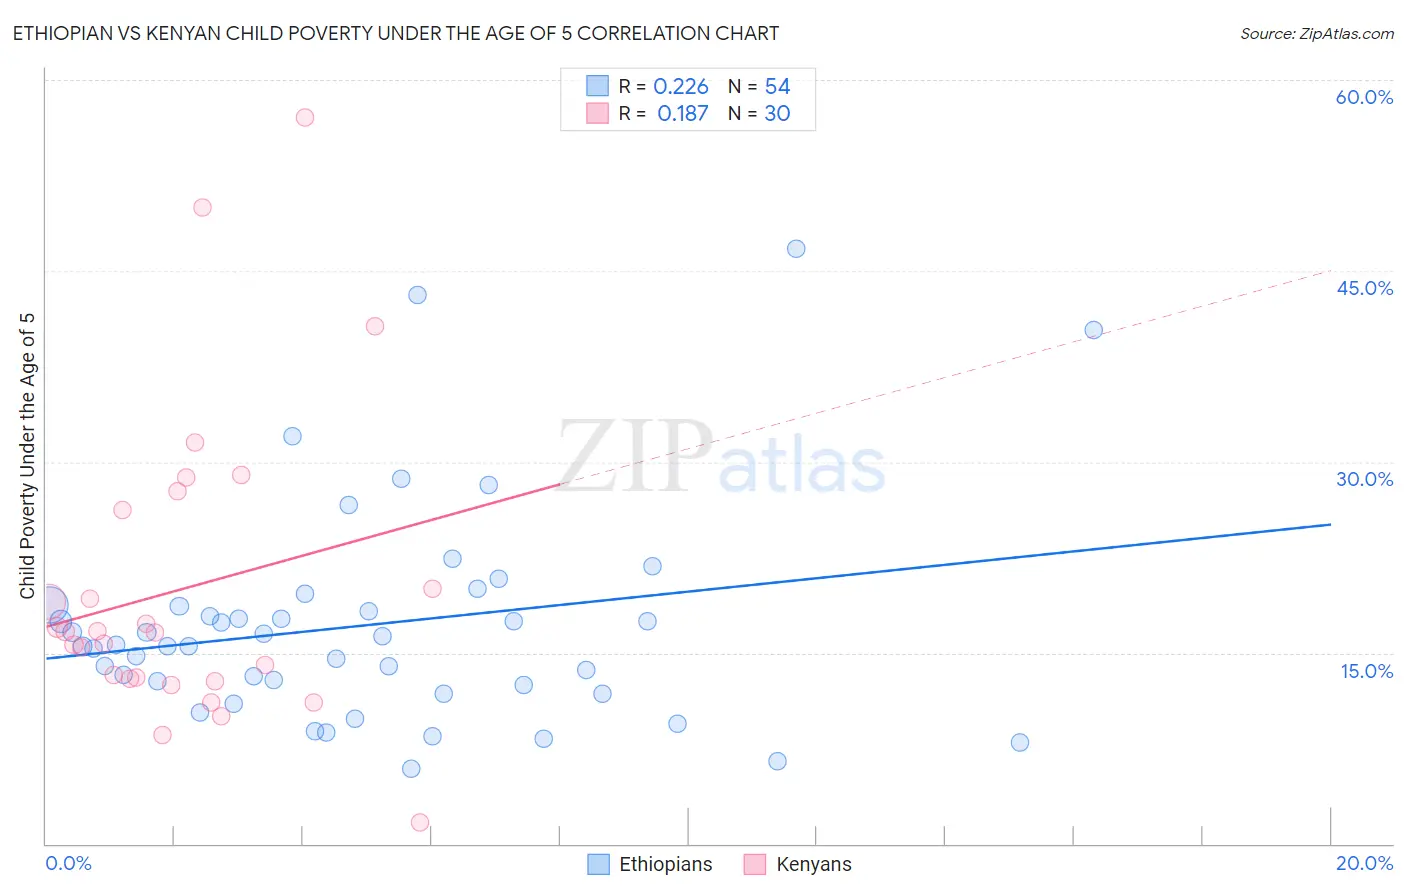
Ethiopian vs Kenyan Child Poverty Under the Age of 5 Correlation Chart
The statistical analysis conducted on geographies consisting of 218,832,621 people shows a weak positive correlation between the proportion of Ethiopians and poverty level among children under the age of 5 in the United States with a correlation coefficient (R) of 0.226 and weighted average of 16.5%. Similarly, the statistical analysis conducted on geographies consisting of 165,881,160 people shows a poor positive correlation between the proportion of Kenyans and poverty level among children under the age of 5 in the United States with a correlation coefficient (R) of 0.187 and weighted average of 17.5%, a difference of 5.9%.
Child Poverty Under the Age of 5 Correlation Summary
| Measurement | Ethiopian | Kenyan |
| Minimum | 5.9% | 1.7% |
| Maximum | 46.8% | 57.1% |
| Range | 40.9% | 55.4% |
| Mean | 17.2% | 20.0% |
| Median | 15.6% | 16.6% |
| Interquartile 25% (IQ1) | 12.5% | 13.0% |
| Interquartile 75% (IQ3) | 18.6% | 26.2% |
| Interquartile Range (IQR) | 6.2% | 13.2% |
| Standard Deviation (Sample) | 8.4% | 12.0% |
| Standard Deviation (Population) | 8.4% | 11.8% |
Similar Demographics by Child Poverty Under the Age of 5
Demographics Similar to Ethiopians by Child Poverty Under the Age of 5
In terms of child poverty under the age of 5, the demographic groups most similar to Ethiopians are Samoan (16.5%, a difference of 0.060%), Portuguese (16.5%, a difference of 0.070%), Immigrants from Western Europe (16.5%, a difference of 0.11%), Immigrants from Ethiopia (16.6%, a difference of 0.11%), and Israeli (16.6%, a difference of 0.12%).
| Demographics | Rating | Rank | Child Poverty Under the Age of 5 |
| Immigrants | Chile | 85.3 /100 | #137 | Excellent 16.4% |
| Germans | 84.8 /100 | #138 | Excellent 16.5% |
| Immigrants | Hungary | 84.5 /100 | #139 | Excellent 16.5% |
| Guamanians/Chamorros | 84.2 /100 | #140 | Excellent 16.5% |
| Immigrants | Western Europe | 83.3 /100 | #141 | Excellent 16.5% |
| Portuguese | 83.0 /100 | #142 | Excellent 16.5% |
| Samoans | 83.0 /100 | #143 | Excellent 16.5% |
| Ethiopians | 82.7 /100 | #144 | Excellent 16.5% |
| Immigrants | Ethiopia | 82.1 /100 | #145 | Excellent 16.6% |
| Israelis | 82.0 /100 | #146 | Excellent 16.6% |
| Immigrants | Nepal | 80.3 /100 | #147 | Excellent 16.6% |
| Syrians | 79.1 /100 | #148 | Good 16.6% |
| New Zealanders | 78.7 /100 | #149 | Good 16.6% |
| Colombians | 77.8 /100 | #150 | Good 16.7% |
| Canadians | 77.6 /100 | #151 | Good 16.7% |
Demographics Similar to Kenyans by Child Poverty Under the Age of 5
In terms of child poverty under the age of 5, the demographic groups most similar to Kenyans are Immigrants from Bosnia and Herzegovina (17.5%, a difference of 0.040%), Carpatho Rusyn (17.5%, a difference of 0.12%), French (17.5%, a difference of 0.12%), Immigrants from Armenia (17.5%, a difference of 0.37%), and Immigrants from Costa Rica (17.4%, a difference of 0.48%).
| Demographics | Rating | Rank | Child Poverty Under the Age of 5 |
| South American Indians | 41.4 /100 | #180 | Average 17.4% |
| Immigrants | Germany | 41.0 /100 | #181 | Average 17.4% |
| Arabs | 40.7 /100 | #182 | Average 17.4% |
| Lebanese | 40.3 /100 | #183 | Average 17.4% |
| Immigrants | Costa Rica | 39.0 /100 | #184 | Fair 17.4% |
| Immigrants | Armenia | 38.0 /100 | #185 | Fair 17.5% |
| Immigrants | Bosnia and Herzegovina | 35.0 /100 | #186 | Fair 17.5% |
| Kenyans | 34.7 /100 | #187 | Fair 17.5% |
| Carpatho Rusyns | 33.6 /100 | #188 | Fair 17.5% |
| French | 33.6 /100 | #189 | Fair 17.5% |
| Slovaks | 29.2 /100 | #190 | Fair 17.6% |
| Immigrants | Afghanistan | 27.9 /100 | #191 | Fair 17.7% |
| Immigrants | Uruguay | 27.8 /100 | #192 | Fair 17.7% |
| Immigrants | Uganda | 25.0 /100 | #193 | Fair 17.7% |
| French Canadians | 24.6 /100 | #194 | Fair 17.7% |