Estonian vs Immigrants from Micronesia Doctorate Degree
COMPARE
Estonian
Immigrants from Micronesia
Doctorate Degree
Doctorate Degree Comparison
Estonians
Immigrants from Micronesia
2.5%
DOCTORATE DEGREE
100.0/ 100
METRIC RATING
40th/ 347
METRIC RANK
1.3%
DOCTORATE DEGREE
0.1/ 100
METRIC RATING
317th/ 347
METRIC RANK
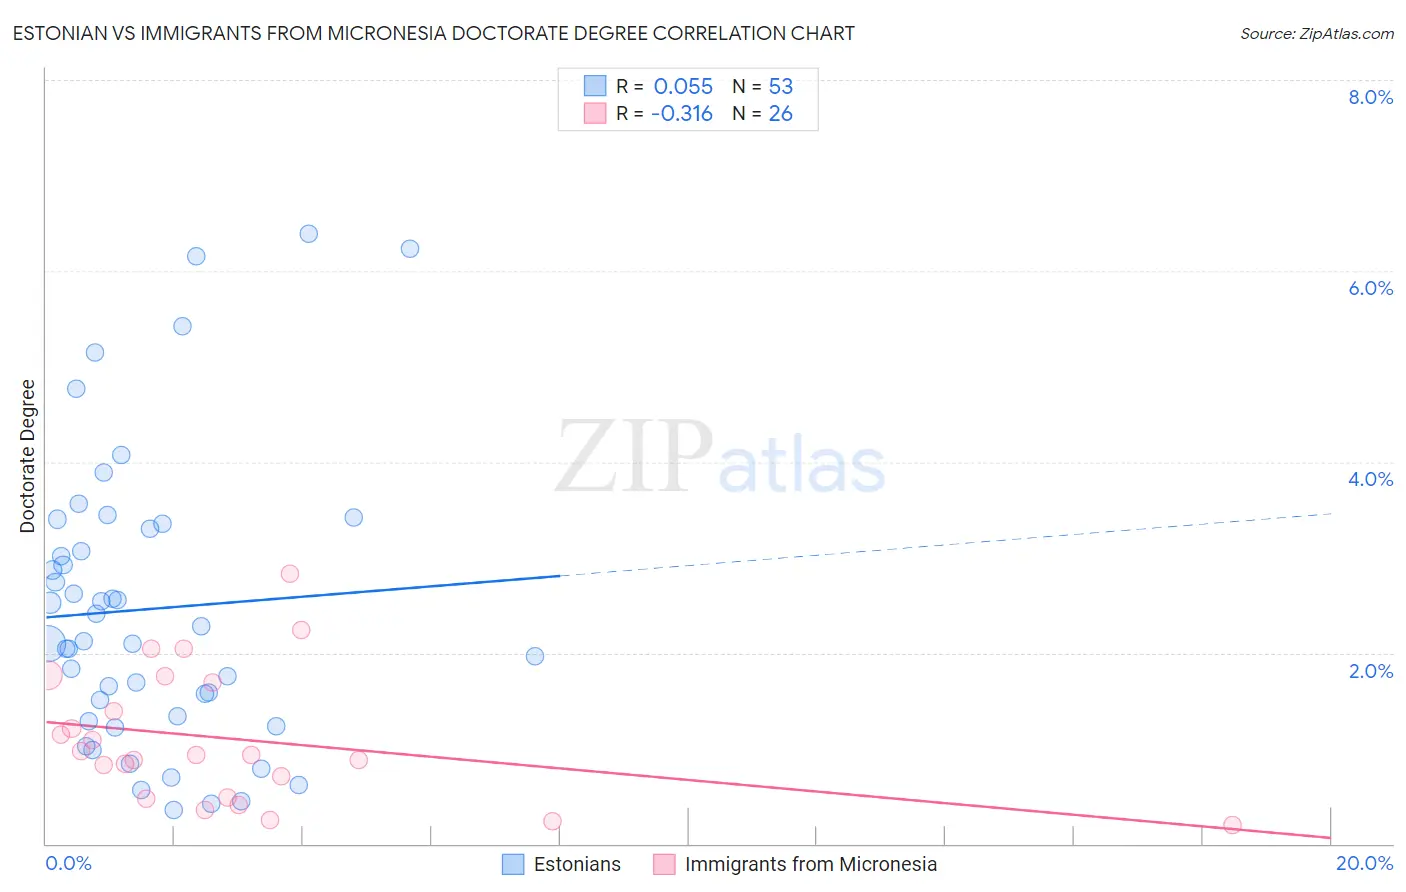
Estonian vs Immigrants from Micronesia Doctorate Degree Correlation Chart
The statistical analysis conducted on geographies consisting of 123,266,987 people shows a slight positive correlation between the proportion of Estonians and percentage of population with at least doctorate degree education in the United States with a correlation coefficient (R) of 0.055 and weighted average of 2.5%. Similarly, the statistical analysis conducted on geographies consisting of 61,316,353 people shows a mild negative correlation between the proportion of Immigrants from Micronesia and percentage of population with at least doctorate degree education in the United States with a correlation coefficient (R) of -0.316 and weighted average of 1.3%, a difference of 87.7%.
Doctorate Degree Correlation Summary
| Measurement | Estonian | Immigrants from Micronesia |
| Minimum | 0.36% | 0.19% |
| Maximum | 6.4% | 2.8% |
| Range | 6.0% | 2.6% |
| Mean | 2.5% | 1.1% |
| Median | 2.1% | 0.93% |
| Interquartile 25% (IQ1) | 1.3% | 0.49% |
| Interquartile 75% (IQ3) | 3.3% | 1.7% |
| Interquartile Range (IQR) | 2.0% | 1.2% |
| Standard Deviation (Sample) | 1.5% | 0.69% |
| Standard Deviation (Population) | 1.5% | 0.68% |
Similar Demographics by Doctorate Degree
Demographics Similar to Estonians by Doctorate Degree
In terms of doctorate degree, the demographic groups most similar to Estonians are Immigrants from Russia (2.5%, a difference of 0.33%), Immigrants from Ireland (2.5%, a difference of 0.41%), Russian (2.6%, a difference of 0.91%), New Zealander (2.5%, a difference of 0.96%), and Immigrants from Kuwait (2.6%, a difference of 1.1%).
| Demographics | Rating | Rank | Doctorate Degree |
| Cambodians | 100.0 /100 | #33 | Exceptional 2.6% |
| Cypriots | 100.0 /100 | #34 | Exceptional 2.6% |
| Immigrants | Malaysia | 100.0 /100 | #35 | Exceptional 2.6% |
| Immigrants | Spain | 100.0 /100 | #36 | Exceptional 2.6% |
| Immigrants | Kuwait | 100.0 /100 | #37 | Exceptional 2.6% |
| Russians | 100.0 /100 | #38 | Exceptional 2.6% |
| Immigrants | Ireland | 100.0 /100 | #39 | Exceptional 2.5% |
| Estonians | 100.0 /100 | #40 | Exceptional 2.5% |
| Immigrants | Russia | 100.0 /100 | #41 | Exceptional 2.5% |
| New Zealanders | 100.0 /100 | #42 | Exceptional 2.5% |
| Soviet Union | 100.0 /100 | #43 | Exceptional 2.5% |
| Immigrants | Netherlands | 100.0 /100 | #44 | Exceptional 2.5% |
| Immigrants | South Africa | 100.0 /100 | #45 | Exceptional 2.4% |
| Immigrants | Austria | 100.0 /100 | #46 | Exceptional 2.4% |
| Immigrants | Western Europe | 100.0 /100 | #47 | Exceptional 2.4% |
Demographics Similar to Immigrants from Micronesia by Doctorate Degree
In terms of doctorate degree, the demographic groups most similar to Immigrants from Micronesia are Creek (1.3%, a difference of 0.050%), Navajo (1.4%, a difference of 0.25%), Immigrants from the Azores (1.4%, a difference of 0.45%), Dominican (1.4%, a difference of 0.48%), and Menominee (1.4%, a difference of 0.55%).
| Demographics | Rating | Rank | Doctorate Degree |
| Immigrants | Jamaica | 0.1 /100 | #310 | Tragic 1.4% |
| Immigrants | Honduras | 0.1 /100 | #311 | Tragic 1.4% |
| Immigrants | Nicaragua | 0.1 /100 | #312 | Tragic 1.4% |
| Menominee | 0.1 /100 | #313 | Tragic 1.4% |
| Dominicans | 0.1 /100 | #314 | Tragic 1.4% |
| Immigrants | Azores | 0.1 /100 | #315 | Tragic 1.4% |
| Navajo | 0.1 /100 | #316 | Tragic 1.4% |
| Immigrants | Micronesia | 0.1 /100 | #317 | Tragic 1.3% |
| Creek | 0.1 /100 | #318 | Tragic 1.3% |
| Immigrants | Guyana | 0.1 /100 | #319 | Tragic 1.3% |
| Immigrants | St. Vincent and the Grenadines | 0.1 /100 | #320 | Tragic 1.3% |
| Dutch West Indians | 0.1 /100 | #321 | Tragic 1.3% |
| Seminole | 0.1 /100 | #322 | Tragic 1.3% |
| Immigrants | Belize | 0.1 /100 | #323 | Tragic 1.3% |
| Natives/Alaskans | 0.0 /100 | #324 | Tragic 1.3% |