Estonian vs Mongolian Doctorate Degree
COMPARE
Estonian
Mongolian
Doctorate Degree
Doctorate Degree Comparison
Estonians
Mongolians
2.5%
DOCTORATE DEGREE
100.0/ 100
METRIC RATING
40th/ 347
METRIC RANK
2.8%
DOCTORATE DEGREE
100.0/ 100
METRIC RATING
22nd/ 347
METRIC RANK
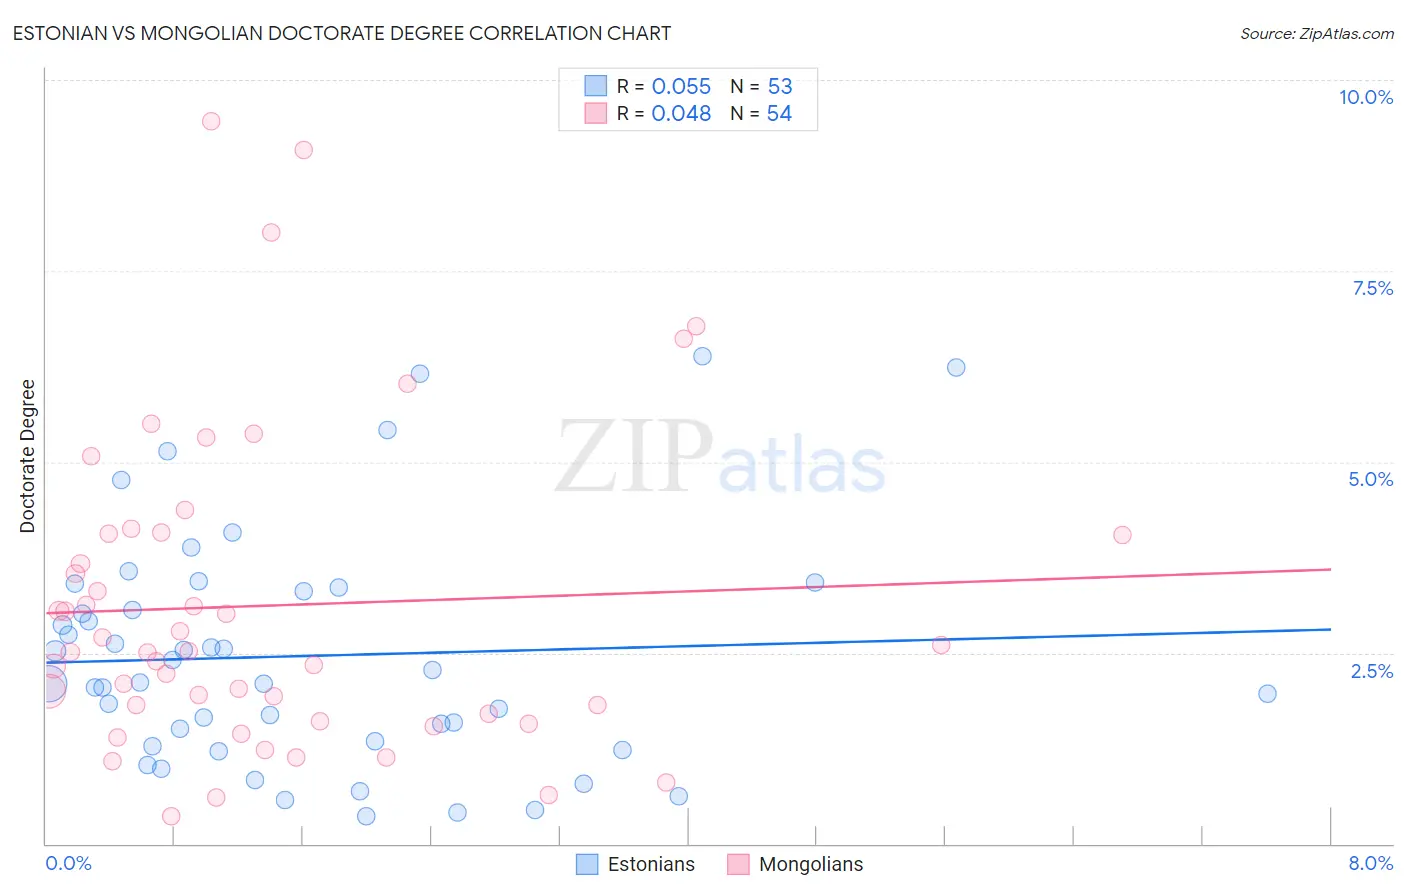
Estonian vs Mongolian Doctorate Degree Correlation Chart
The statistical analysis conducted on geographies consisting of 123,266,987 people shows a slight positive correlation between the proportion of Estonians and percentage of population with at least doctorate degree education in the United States with a correlation coefficient (R) of 0.055 and weighted average of 2.5%. Similarly, the statistical analysis conducted on geographies consisting of 140,132,264 people shows no correlation between the proportion of Mongolians and percentage of population with at least doctorate degree education in the United States with a correlation coefficient (R) of 0.048 and weighted average of 2.8%, a difference of 9.1%.
Doctorate Degree Correlation Summary
| Measurement | Estonian | Mongolian |
| Minimum | 0.36% | 0.36% |
| Maximum | 6.4% | 9.5% |
| Range | 6.0% | 9.1% |
| Mean | 2.5% | 3.1% |
| Median | 2.1% | 2.5% |
| Interquartile 25% (IQ1) | 1.3% | 1.7% |
| Interquartile 75% (IQ3) | 3.3% | 4.1% |
| Interquartile Range (IQR) | 2.0% | 2.4% |
| Standard Deviation (Sample) | 1.5% | 2.1% |
| Standard Deviation (Population) | 1.5% | 2.1% |
Demographics Similar to Estonians and Mongolians by Doctorate Degree
In terms of doctorate degree, the demographic groups most similar to Estonians are Immigrants from Russia (2.5%, a difference of 0.33%), Immigrants from Ireland (2.5%, a difference of 0.41%), Russian (2.6%, a difference of 0.91%), Immigrants from Kuwait (2.6%, a difference of 1.1%), and Immigrants from Spain (2.6%, a difference of 1.3%). Similarly, the demographic groups most similar to Mongolians are Immigrants from Denmark (2.8%, a difference of 0.13%), Thai (2.8%, a difference of 0.20%), Israeli (2.7%, a difference of 1.4%), Immigrants from Saudi Arabia (2.7%, a difference of 2.9%), and Turkish (2.7%, a difference of 3.5%).
| Demographics | Rating | Rank | Doctorate Degree |
| Thais | 100.0 /100 | #21 | Exceptional 2.8% |
| Mongolians | 100.0 /100 | #22 | Exceptional 2.8% |
| Immigrants | Denmark | 100.0 /100 | #23 | Exceptional 2.8% |
| Israelis | 100.0 /100 | #24 | Exceptional 2.7% |
| Immigrants | Saudi Arabia | 100.0 /100 | #25 | Exceptional 2.7% |
| Turks | 100.0 /100 | #26 | Exceptional 2.7% |
| Immigrants | Turkey | 100.0 /100 | #27 | Exceptional 2.6% |
| Burmese | 100.0 /100 | #28 | Exceptional 2.6% |
| Immigrants | South Central Asia | 100.0 /100 | #29 | Exceptional 2.6% |
| Immigrants | Korea | 100.0 /100 | #30 | Exceptional 2.6% |
| Latvians | 100.0 /100 | #31 | Exceptional 2.6% |
| Immigrants | Northern Europe | 100.0 /100 | #32 | Exceptional 2.6% |
| Cambodians | 100.0 /100 | #33 | Exceptional 2.6% |
| Cypriots | 100.0 /100 | #34 | Exceptional 2.6% |
| Immigrants | Malaysia | 100.0 /100 | #35 | Exceptional 2.6% |
| Immigrants | Spain | 100.0 /100 | #36 | Exceptional 2.6% |
| Immigrants | Kuwait | 100.0 /100 | #37 | Exceptional 2.6% |
| Russians | 100.0 /100 | #38 | Exceptional 2.6% |
| Immigrants | Ireland | 100.0 /100 | #39 | Exceptional 2.5% |
| Estonians | 100.0 /100 | #40 | Exceptional 2.5% |
| Immigrants | Russia | 100.0 /100 | #41 | Exceptional 2.5% |