Estonian vs Immigrants from Oceania Doctorate Degree
COMPARE
Estonian
Immigrants from Oceania
Doctorate Degree
Doctorate Degree Comparison
Estonians
Immigrants from Oceania
2.5%
DOCTORATE DEGREE
100.0/ 100
METRIC RATING
40th/ 347
METRIC RANK
1.9%
DOCTORATE DEGREE
74.0/ 100
METRIC RATING
153rd/ 347
METRIC RANK
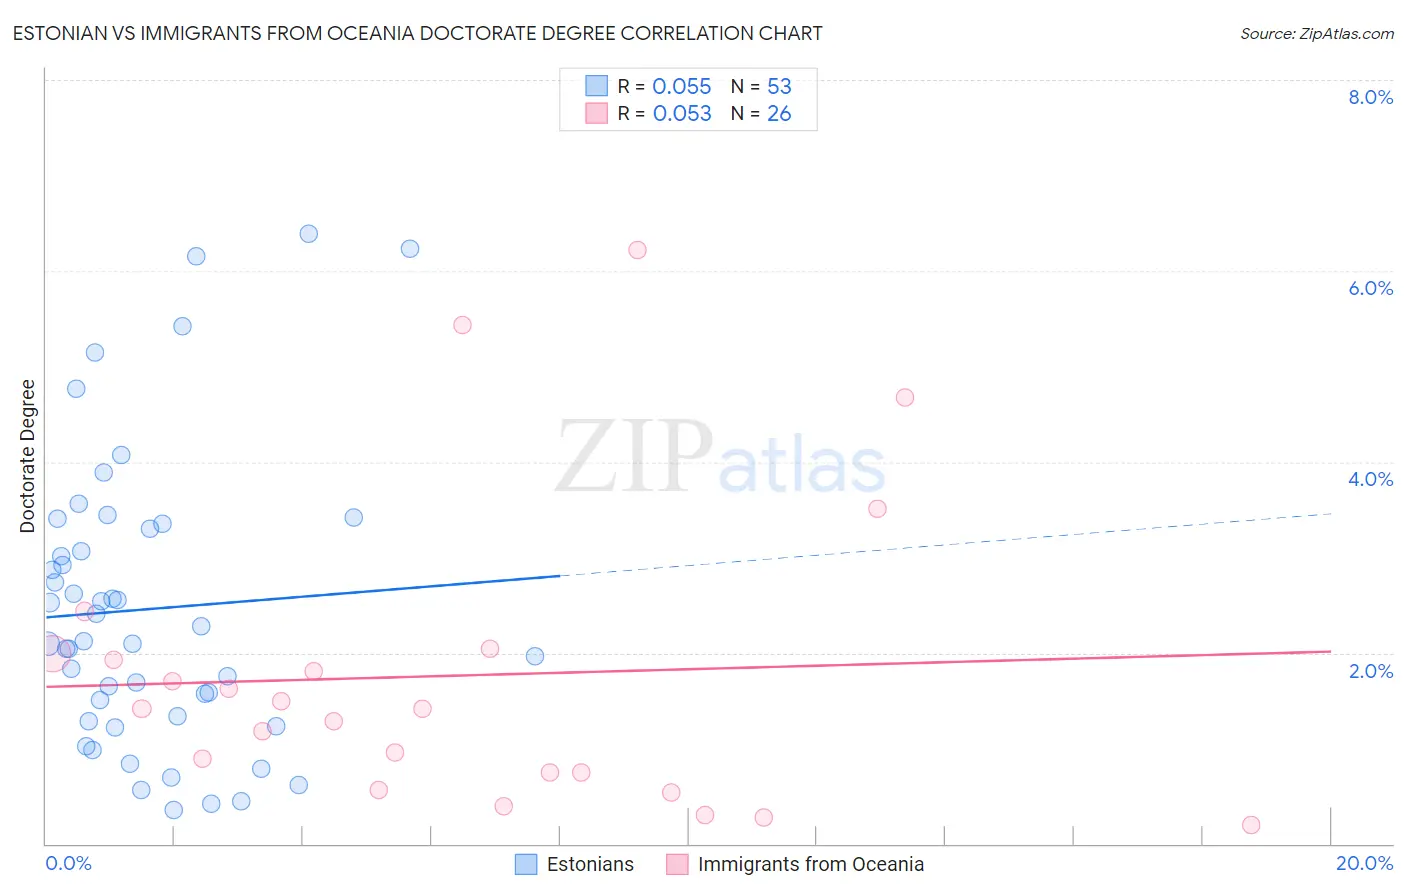
Estonian vs Immigrants from Oceania Doctorate Degree Correlation Chart
The statistical analysis conducted on geographies consisting of 123,266,987 people shows a slight positive correlation between the proportion of Estonians and percentage of population with at least doctorate degree education in the United States with a correlation coefficient (R) of 0.055 and weighted average of 2.5%. Similarly, the statistical analysis conducted on geographies consisting of 303,370,290 people shows a slight positive correlation between the proportion of Immigrants from Oceania and percentage of population with at least doctorate degree education in the United States with a correlation coefficient (R) of 0.053 and weighted average of 1.9%, a difference of 32.4%.
Doctorate Degree Correlation Summary
| Measurement | Estonian | Immigrants from Oceania |
| Minimum | 0.36% | 0.19% |
| Maximum | 6.4% | 6.2% |
| Range | 6.0% | 6.0% |
| Mean | 2.5% | 1.8% |
| Median | 2.1% | 1.4% |
| Interquartile 25% (IQ1) | 1.3% | 0.75% |
| Interquartile 75% (IQ3) | 3.3% | 2.0% |
| Interquartile Range (IQR) | 2.0% | 1.2% |
| Standard Deviation (Sample) | 1.5% | 1.6% |
| Standard Deviation (Population) | 1.5% | 1.5% |
Similar Demographics by Doctorate Degree
Demographics Similar to Estonians by Doctorate Degree
In terms of doctorate degree, the demographic groups most similar to Estonians are Immigrants from Russia (2.5%, a difference of 0.33%), Immigrants from Ireland (2.5%, a difference of 0.41%), Russian (2.6%, a difference of 0.91%), New Zealander (2.5%, a difference of 0.96%), and Immigrants from Kuwait (2.6%, a difference of 1.1%).
| Demographics | Rating | Rank | Doctorate Degree |
| Cambodians | 100.0 /100 | #33 | Exceptional 2.6% |
| Cypriots | 100.0 /100 | #34 | Exceptional 2.6% |
| Immigrants | Malaysia | 100.0 /100 | #35 | Exceptional 2.6% |
| Immigrants | Spain | 100.0 /100 | #36 | Exceptional 2.6% |
| Immigrants | Kuwait | 100.0 /100 | #37 | Exceptional 2.6% |
| Russians | 100.0 /100 | #38 | Exceptional 2.6% |
| Immigrants | Ireland | 100.0 /100 | #39 | Exceptional 2.5% |
| Estonians | 100.0 /100 | #40 | Exceptional 2.5% |
| Immigrants | Russia | 100.0 /100 | #41 | Exceptional 2.5% |
| New Zealanders | 100.0 /100 | #42 | Exceptional 2.5% |
| Soviet Union | 100.0 /100 | #43 | Exceptional 2.5% |
| Immigrants | Netherlands | 100.0 /100 | #44 | Exceptional 2.5% |
| Immigrants | South Africa | 100.0 /100 | #45 | Exceptional 2.4% |
| Immigrants | Austria | 100.0 /100 | #46 | Exceptional 2.4% |
| Immigrants | Western Europe | 100.0 /100 | #47 | Exceptional 2.4% |
Demographics Similar to Immigrants from Oceania by Doctorate Degree
In terms of doctorate degree, the demographic groups most similar to Immigrants from Oceania are Immigrants from Kenya (1.9%, a difference of 0.050%), Albanian (1.9%, a difference of 0.15%), Immigrants from Albania (1.9%, a difference of 0.22%), Polish (1.9%, a difference of 0.24%), and Slavic (1.9%, a difference of 0.30%).
| Demographics | Rating | Rank | Doctorate Degree |
| Immigrants | Syria | 83.6 /100 | #146 | Excellent 1.9% |
| Immigrants | Senegal | 82.5 /100 | #147 | Excellent 1.9% |
| Luxembourgers | 81.1 /100 | #148 | Excellent 1.9% |
| Basques | 76.9 /100 | #149 | Good 1.9% |
| English | 75.9 /100 | #150 | Good 1.9% |
| Albanians | 74.8 /100 | #151 | Good 1.9% |
| Immigrants | Kenya | 74.3 /100 | #152 | Good 1.9% |
| Immigrants | Oceania | 74.0 /100 | #153 | Good 1.9% |
| Immigrants | Albania | 72.8 /100 | #154 | Good 1.9% |
| Poles | 72.7 /100 | #155 | Good 1.9% |
| Slavs | 72.4 /100 | #156 | Good 1.9% |
| Danes | 71.9 /100 | #157 | Good 1.9% |
| Hungarians | 71.7 /100 | #158 | Good 1.9% |
| Slovenes | 70.2 /100 | #159 | Good 1.9% |
| Welsh | 69.7 /100 | #160 | Good 1.9% |