Immigrants from Iraq vs Immigrants from Micronesia Doctorate Degree
COMPARE
Immigrants from Iraq
Immigrants from Micronesia
Doctorate Degree
Doctorate Degree Comparison
Immigrants from Iraq
Immigrants from Micronesia
1.7%
DOCTORATE DEGREE
10.7/ 100
METRIC RATING
219th/ 347
METRIC RANK
1.3%
DOCTORATE DEGREE
0.1/ 100
METRIC RATING
317th/ 347
METRIC RANK
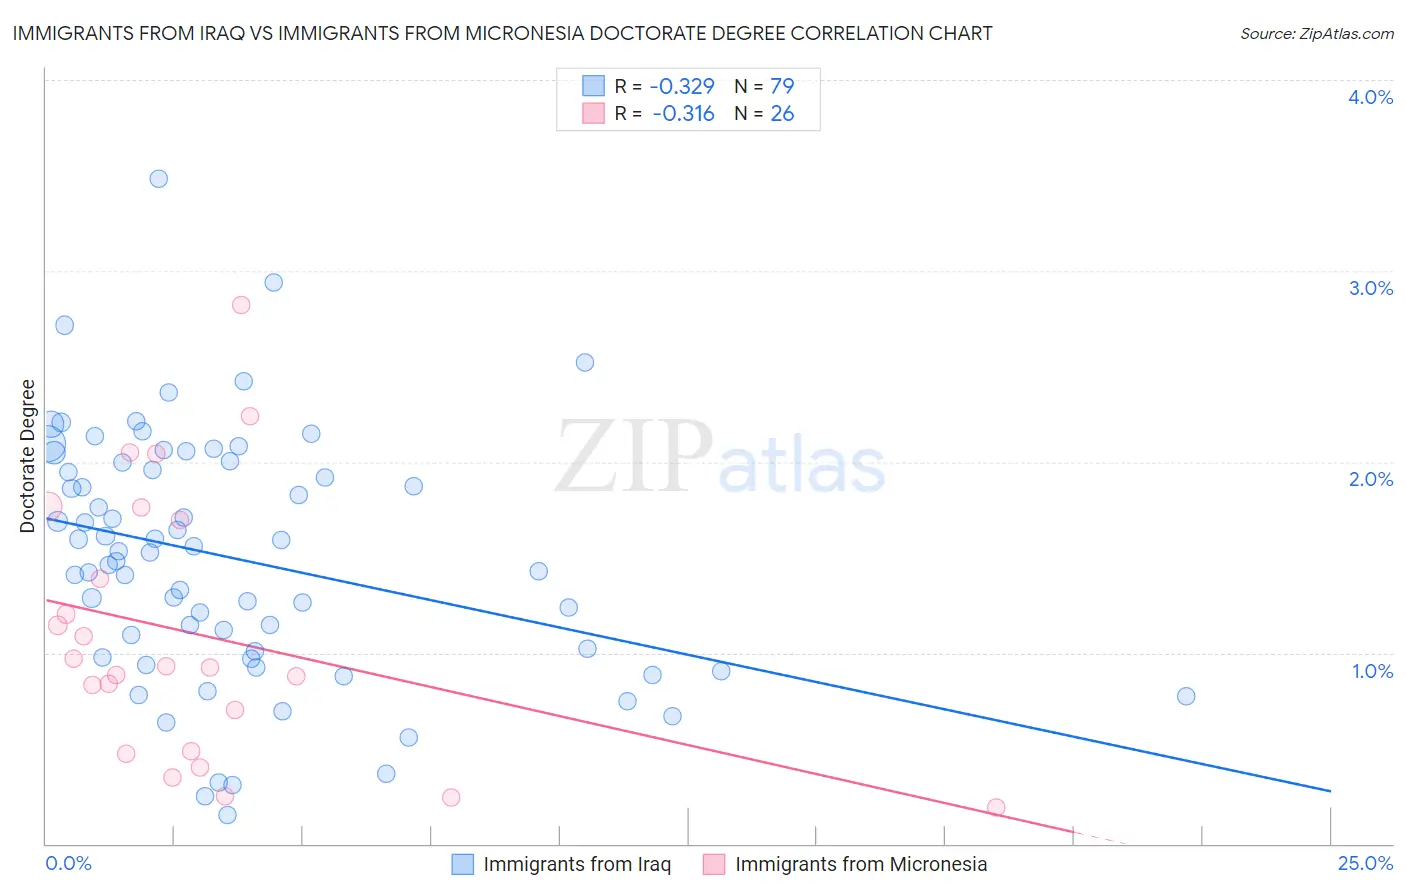
Immigrants from Iraq vs Immigrants from Micronesia Doctorate Degree Correlation Chart
The statistical analysis conducted on geographies consisting of 194,187,251 people shows a mild negative correlation between the proportion of Immigrants from Iraq and percentage of population with at least doctorate degree education in the United States with a correlation coefficient (R) of -0.329 and weighted average of 1.7%. Similarly, the statistical analysis conducted on geographies consisting of 61,316,353 people shows a mild negative correlation between the proportion of Immigrants from Micronesia and percentage of population with at least doctorate degree education in the United States with a correlation coefficient (R) of -0.316 and weighted average of 1.3%, a difference of 25.9%.
Doctorate Degree Correlation Summary
| Measurement | Immigrants from Iraq | Immigrants from Micronesia |
| Minimum | 0.15% | 0.19% |
| Maximum | 3.5% | 2.8% |
| Range | 3.3% | 2.6% |
| Mean | 1.5% | 1.1% |
| Median | 1.5% | 0.93% |
| Interquartile 25% (IQ1) | 0.97% | 0.49% |
| Interquartile 75% (IQ3) | 2.0% | 1.7% |
| Interquartile Range (IQR) | 1.0% | 1.2% |
| Standard Deviation (Sample) | 0.65% | 0.69% |
| Standard Deviation (Population) | 0.65% | 0.68% |
Similar Demographics by Doctorate Degree
Demographics Similar to Immigrants from Iraq by Doctorate Degree
In terms of doctorate degree, the demographic groups most similar to Immigrants from Iraq are Tlingit-Haida (1.7%, a difference of 0.46%), Immigrants from Uruguay (1.7%, a difference of 0.66%), Spanish American (1.7%, a difference of 0.84%), Nonimmigrants (1.7%, a difference of 0.85%), and Immigrants from Venezuela (1.7%, a difference of 0.92%).
| Demographics | Rating | Rank | Doctorate Degree |
| Immigrants | South Eastern Asia | 14.7 /100 | #212 | Poor 1.7% |
| Koreans | 14.2 /100 | #213 | Poor 1.7% |
| Pueblo | 14.2 /100 | #214 | Poor 1.7% |
| Alaskan Athabascans | 13.8 /100 | #215 | Poor 1.7% |
| Immigrants | Burma/Myanmar | 13.5 /100 | #216 | Poor 1.7% |
| Spanish Americans | 12.9 /100 | #217 | Poor 1.7% |
| Tlingit-Haida | 11.9 /100 | #218 | Poor 1.7% |
| Immigrants | Iraq | 10.7 /100 | #219 | Poor 1.7% |
| Immigrants | Uruguay | 9.2 /100 | #220 | Tragic 1.7% |
| Immigrants | Nonimmigrants | 8.8 /100 | #221 | Tragic 1.7% |
| Immigrants | Venezuela | 8.7 /100 | #222 | Tragic 1.7% |
| Immigrants | Bosnia and Herzegovina | 7.8 /100 | #223 | Tragic 1.7% |
| Immigrants | Poland | 7.4 /100 | #224 | Tragic 1.7% |
| Immigrants | Colombia | 6.7 /100 | #225 | Tragic 1.7% |
| Osage | 6.5 /100 | #226 | Tragic 1.7% |
Demographics Similar to Immigrants from Micronesia by Doctorate Degree
In terms of doctorate degree, the demographic groups most similar to Immigrants from Micronesia are Creek (1.3%, a difference of 0.050%), Navajo (1.4%, a difference of 0.25%), Immigrants from the Azores (1.4%, a difference of 0.45%), Dominican (1.4%, a difference of 0.48%), and Menominee (1.4%, a difference of 0.55%).
| Demographics | Rating | Rank | Doctorate Degree |
| Immigrants | Jamaica | 0.1 /100 | #310 | Tragic 1.4% |
| Immigrants | Honduras | 0.1 /100 | #311 | Tragic 1.4% |
| Immigrants | Nicaragua | 0.1 /100 | #312 | Tragic 1.4% |
| Menominee | 0.1 /100 | #313 | Tragic 1.4% |
| Dominicans | 0.1 /100 | #314 | Tragic 1.4% |
| Immigrants | Azores | 0.1 /100 | #315 | Tragic 1.4% |
| Navajo | 0.1 /100 | #316 | Tragic 1.4% |
| Immigrants | Micronesia | 0.1 /100 | #317 | Tragic 1.3% |
| Creek | 0.1 /100 | #318 | Tragic 1.3% |
| Immigrants | Guyana | 0.1 /100 | #319 | Tragic 1.3% |
| Immigrants | St. Vincent and the Grenadines | 0.1 /100 | #320 | Tragic 1.3% |
| Dutch West Indians | 0.1 /100 | #321 | Tragic 1.3% |
| Seminole | 0.1 /100 | #322 | Tragic 1.3% |
| Immigrants | Belize | 0.1 /100 | #323 | Tragic 1.3% |
| Natives/Alaskans | 0.0 /100 | #324 | Tragic 1.3% |