Estonian vs Immigrants from Eastern Europe Doctorate Degree
COMPARE
Estonian
Immigrants from Eastern Europe
Doctorate Degree
Doctorate Degree Comparison
Estonians
Immigrants from Eastern Europe
2.5%
DOCTORATE DEGREE
100.0/ 100
METRIC RATING
40th/ 347
METRIC RANK
2.1%
DOCTORATE DEGREE
98.2/ 100
METRIC RATING
100th/ 347
METRIC RANK
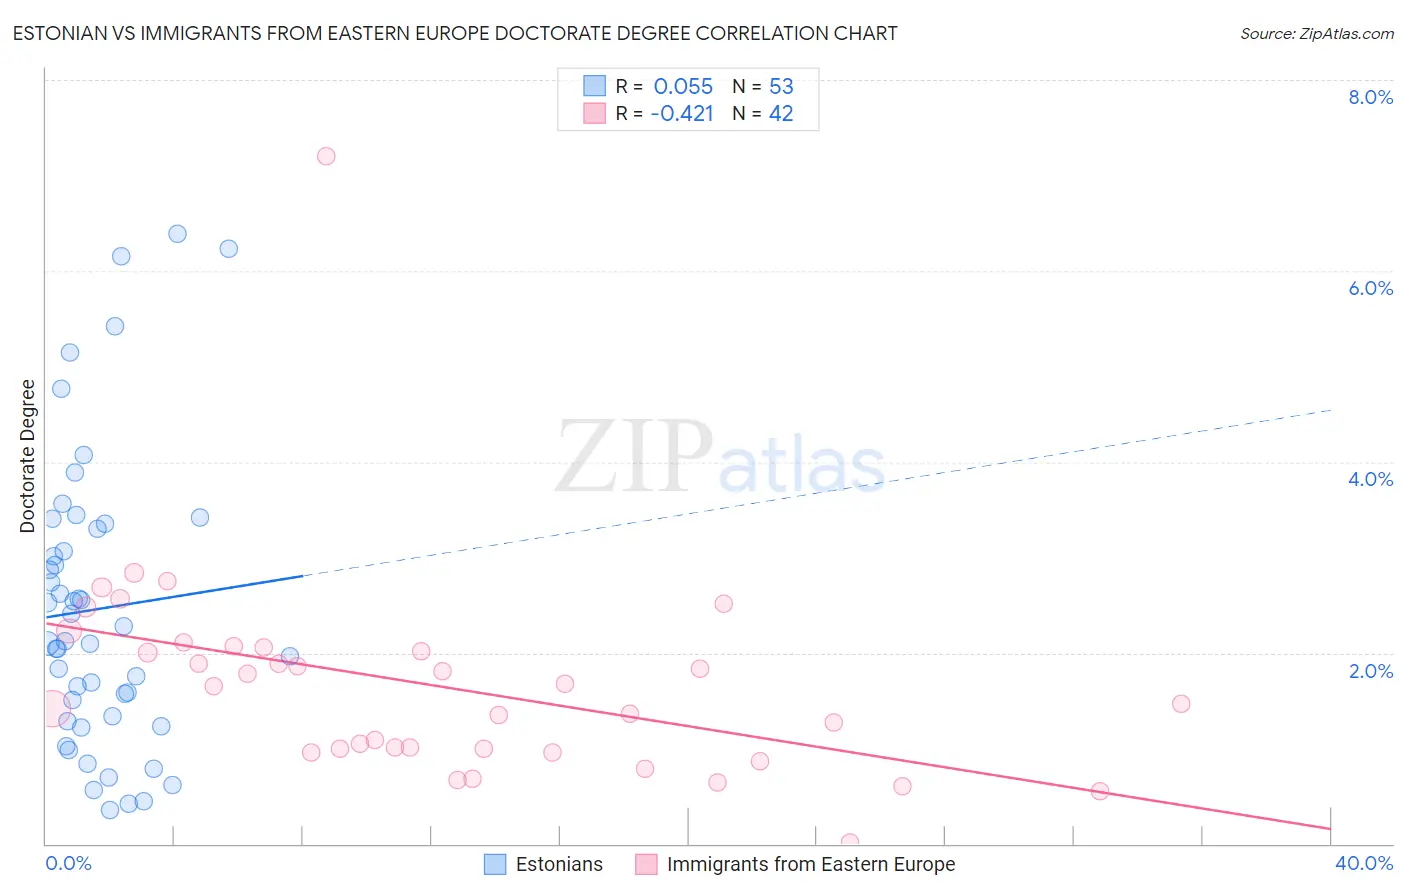
Estonian vs Immigrants from Eastern Europe Doctorate Degree Correlation Chart
The statistical analysis conducted on geographies consisting of 123,266,987 people shows a slight positive correlation between the proportion of Estonians and percentage of population with at least doctorate degree education in the United States with a correlation coefficient (R) of 0.055 and weighted average of 2.5%. Similarly, the statistical analysis conducted on geographies consisting of 469,545,565 people shows a moderate negative correlation between the proportion of Immigrants from Eastern Europe and percentage of population with at least doctorate degree education in the United States with a correlation coefficient (R) of -0.421 and weighted average of 2.1%, a difference of 19.8%.
Doctorate Degree Correlation Summary
| Measurement | Estonian | Immigrants from Eastern Europe |
| Minimum | 0.36% | 0.013% |
| Maximum | 6.4% | 7.2% |
| Range | 6.0% | 7.2% |
| Mean | 2.5% | 1.7% |
| Median | 2.1% | 1.6% |
| Interquartile 25% (IQ1) | 1.3% | 0.99% |
| Interquartile 75% (IQ3) | 3.3% | 2.1% |
| Interquartile Range (IQR) | 2.0% | 1.1% |
| Standard Deviation (Sample) | 1.5% | 1.1% |
| Standard Deviation (Population) | 1.5% | 1.1% |
Similar Demographics by Doctorate Degree
Demographics Similar to Estonians by Doctorate Degree
In terms of doctorate degree, the demographic groups most similar to Estonians are Immigrants from Russia (2.5%, a difference of 0.33%), Immigrants from Ireland (2.5%, a difference of 0.41%), Russian (2.6%, a difference of 0.91%), New Zealander (2.5%, a difference of 0.96%), and Immigrants from Kuwait (2.6%, a difference of 1.1%).
| Demographics | Rating | Rank | Doctorate Degree |
| Cambodians | 100.0 /100 | #33 | Exceptional 2.6% |
| Cypriots | 100.0 /100 | #34 | Exceptional 2.6% |
| Immigrants | Malaysia | 100.0 /100 | #35 | Exceptional 2.6% |
| Immigrants | Spain | 100.0 /100 | #36 | Exceptional 2.6% |
| Immigrants | Kuwait | 100.0 /100 | #37 | Exceptional 2.6% |
| Russians | 100.0 /100 | #38 | Exceptional 2.6% |
| Immigrants | Ireland | 100.0 /100 | #39 | Exceptional 2.5% |
| Estonians | 100.0 /100 | #40 | Exceptional 2.5% |
| Immigrants | Russia | 100.0 /100 | #41 | Exceptional 2.5% |
| New Zealanders | 100.0 /100 | #42 | Exceptional 2.5% |
| Soviet Union | 100.0 /100 | #43 | Exceptional 2.5% |
| Immigrants | Netherlands | 100.0 /100 | #44 | Exceptional 2.5% |
| Immigrants | South Africa | 100.0 /100 | #45 | Exceptional 2.4% |
| Immigrants | Austria | 100.0 /100 | #46 | Exceptional 2.4% |
| Immigrants | Western Europe | 100.0 /100 | #47 | Exceptional 2.4% |
Demographics Similar to Immigrants from Eastern Europe by Doctorate Degree
In terms of doctorate degree, the demographic groups most similar to Immigrants from Eastern Europe are Immigrants from Egypt (2.1%, a difference of 0.0%), Immigrants from Eastern Africa (2.1%, a difference of 0.030%), Armenian (2.1%, a difference of 0.18%), Immigrants from Chile (2.1%, a difference of 0.25%), and Immigrants from Eritrea (2.1%, a difference of 0.26%).
| Demographics | Rating | Rank | Doctorate Degree |
| Alsatians | 99.0 /100 | #93 | Exceptional 2.1% |
| Greeks | 98.8 /100 | #94 | Exceptional 2.1% |
| Immigrants | Romania | 98.7 /100 | #95 | Exceptional 2.1% |
| Immigrants | Northern Africa | 98.4 /100 | #96 | Exceptional 2.1% |
| Immigrants | Eritrea | 98.4 /100 | #97 | Exceptional 2.1% |
| Armenians | 98.3 /100 | #98 | Exceptional 2.1% |
| Immigrants | Egypt | 98.2 /100 | #99 | Exceptional 2.1% |
| Immigrants | Eastern Europe | 98.2 /100 | #100 | Exceptional 2.1% |
| Immigrants | Eastern Africa | 98.2 /100 | #101 | Exceptional 2.1% |
| Immigrants | Chile | 98.1 /100 | #102 | Exceptional 2.1% |
| Romanians | 98.1 /100 | #103 | Exceptional 2.1% |
| Austrians | 98.0 /100 | #104 | Exceptional 2.1% |
| Arabs | 97.8 /100 | #105 | Exceptional 2.1% |
| Sudanese | 97.7 /100 | #106 | Exceptional 2.1% |
| Europeans | 97.5 /100 | #107 | Exceptional 2.1% |