Estonian vs Immigrants from Nicaragua Doctorate Degree
COMPARE
Estonian
Immigrants from Nicaragua
Doctorate Degree
Doctorate Degree Comparison
Estonians
Immigrants from Nicaragua
2.5%
DOCTORATE DEGREE
100.0/ 100
METRIC RATING
40th/ 347
METRIC RANK
1.4%
DOCTORATE DEGREE
0.1/ 100
METRIC RATING
312th/ 347
METRIC RANK
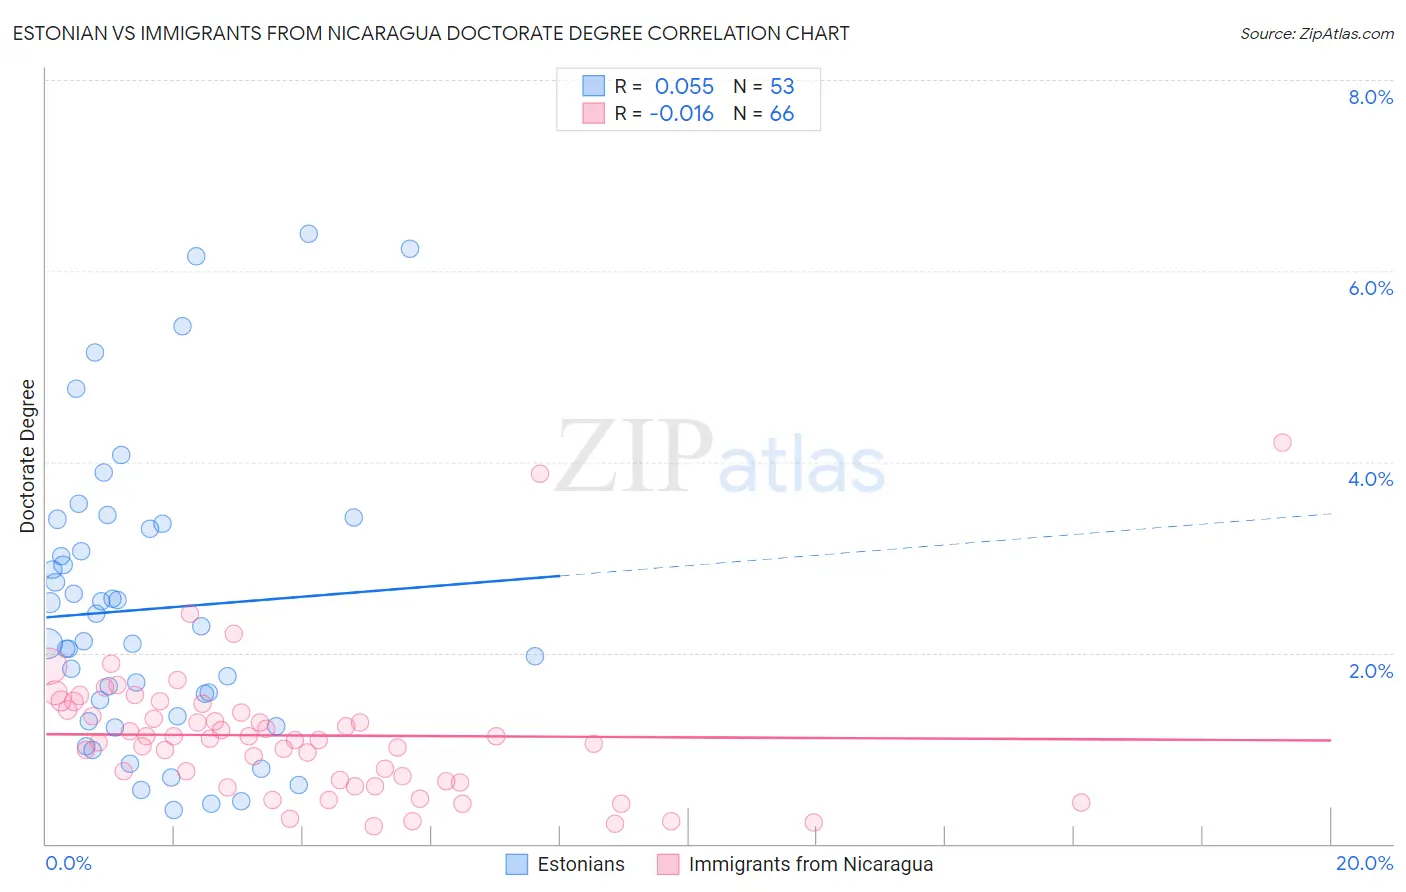
Estonian vs Immigrants from Nicaragua Doctorate Degree Correlation Chart
The statistical analysis conducted on geographies consisting of 123,266,987 people shows a slight positive correlation between the proportion of Estonians and percentage of population with at least doctorate degree education in the United States with a correlation coefficient (R) of 0.055 and weighted average of 2.5%. Similarly, the statistical analysis conducted on geographies consisting of 234,843,041 people shows no correlation between the proportion of Immigrants from Nicaragua and percentage of population with at least doctorate degree education in the United States with a correlation coefficient (R) of -0.016 and weighted average of 1.4%, a difference of 86.1%.
Doctorate Degree Correlation Summary
| Measurement | Estonian | Immigrants from Nicaragua |
| Minimum | 0.36% | 0.18% |
| Maximum | 6.4% | 4.2% |
| Range | 6.0% | 4.0% |
| Mean | 2.5% | 1.1% |
| Median | 2.1% | 1.1% |
| Interquartile 25% (IQ1) | 1.3% | 0.66% |
| Interquartile 75% (IQ3) | 3.3% | 1.4% |
| Interquartile Range (IQR) | 2.0% | 0.74% |
| Standard Deviation (Sample) | 1.5% | 0.71% |
| Standard Deviation (Population) | 1.5% | 0.71% |
Similar Demographics by Doctorate Degree
Demographics Similar to Estonians by Doctorate Degree
In terms of doctorate degree, the demographic groups most similar to Estonians are Immigrants from Russia (2.5%, a difference of 0.33%), Immigrants from Ireland (2.5%, a difference of 0.41%), Russian (2.6%, a difference of 0.91%), New Zealander (2.5%, a difference of 0.96%), and Immigrants from Kuwait (2.6%, a difference of 1.1%).
| Demographics | Rating | Rank | Doctorate Degree |
| Cambodians | 100.0 /100 | #33 | Exceptional 2.6% |
| Cypriots | 100.0 /100 | #34 | Exceptional 2.6% |
| Immigrants | Malaysia | 100.0 /100 | #35 | Exceptional 2.6% |
| Immigrants | Spain | 100.0 /100 | #36 | Exceptional 2.6% |
| Immigrants | Kuwait | 100.0 /100 | #37 | Exceptional 2.6% |
| Russians | 100.0 /100 | #38 | Exceptional 2.6% |
| Immigrants | Ireland | 100.0 /100 | #39 | Exceptional 2.5% |
| Estonians | 100.0 /100 | #40 | Exceptional 2.5% |
| Immigrants | Russia | 100.0 /100 | #41 | Exceptional 2.5% |
| New Zealanders | 100.0 /100 | #42 | Exceptional 2.5% |
| Soviet Union | 100.0 /100 | #43 | Exceptional 2.5% |
| Immigrants | Netherlands | 100.0 /100 | #44 | Exceptional 2.5% |
| Immigrants | South Africa | 100.0 /100 | #45 | Exceptional 2.4% |
| Immigrants | Austria | 100.0 /100 | #46 | Exceptional 2.4% |
| Immigrants | Western Europe | 100.0 /100 | #47 | Exceptional 2.4% |
Demographics Similar to Immigrants from Nicaragua by Doctorate Degree
In terms of doctorate degree, the demographic groups most similar to Immigrants from Nicaragua are Menominee (1.4%, a difference of 0.32%), Immigrants from Honduras (1.4%, a difference of 0.38%), Dominican (1.4%, a difference of 0.39%), Immigrants from the Azores (1.4%, a difference of 0.42%), and Immigrants from Jamaica (1.4%, a difference of 0.55%).
| Demographics | Rating | Rank | Doctorate Degree |
| Pennsylvania Germans | 0.1 /100 | #305 | Tragic 1.4% |
| Guyanese | 0.1 /100 | #306 | Tragic 1.4% |
| Cubans | 0.1 /100 | #307 | Tragic 1.4% |
| Immigrants | Laos | 0.1 /100 | #308 | Tragic 1.4% |
| Immigrants | Grenada | 0.1 /100 | #309 | Tragic 1.4% |
| Immigrants | Jamaica | 0.1 /100 | #310 | Tragic 1.4% |
| Immigrants | Honduras | 0.1 /100 | #311 | Tragic 1.4% |
| Immigrants | Nicaragua | 0.1 /100 | #312 | Tragic 1.4% |
| Menominee | 0.1 /100 | #313 | Tragic 1.4% |
| Dominicans | 0.1 /100 | #314 | Tragic 1.4% |
| Immigrants | Azores | 0.1 /100 | #315 | Tragic 1.4% |
| Navajo | 0.1 /100 | #316 | Tragic 1.4% |
| Immigrants | Micronesia | 0.1 /100 | #317 | Tragic 1.3% |
| Creek | 0.1 /100 | #318 | Tragic 1.3% |
| Immigrants | Guyana | 0.1 /100 | #319 | Tragic 1.3% |