Ottawa vs Immigrants from Micronesia Doctorate Degree
COMPARE
Ottawa
Immigrants from Micronesia
Doctorate Degree
Doctorate Degree Comparison
Ottawa
Immigrants from Micronesia
1.6%
DOCTORATE DEGREE
2.2/ 100
METRIC RATING
242nd/ 347
METRIC RANK
1.3%
DOCTORATE DEGREE
0.1/ 100
METRIC RATING
317th/ 347
METRIC RANK
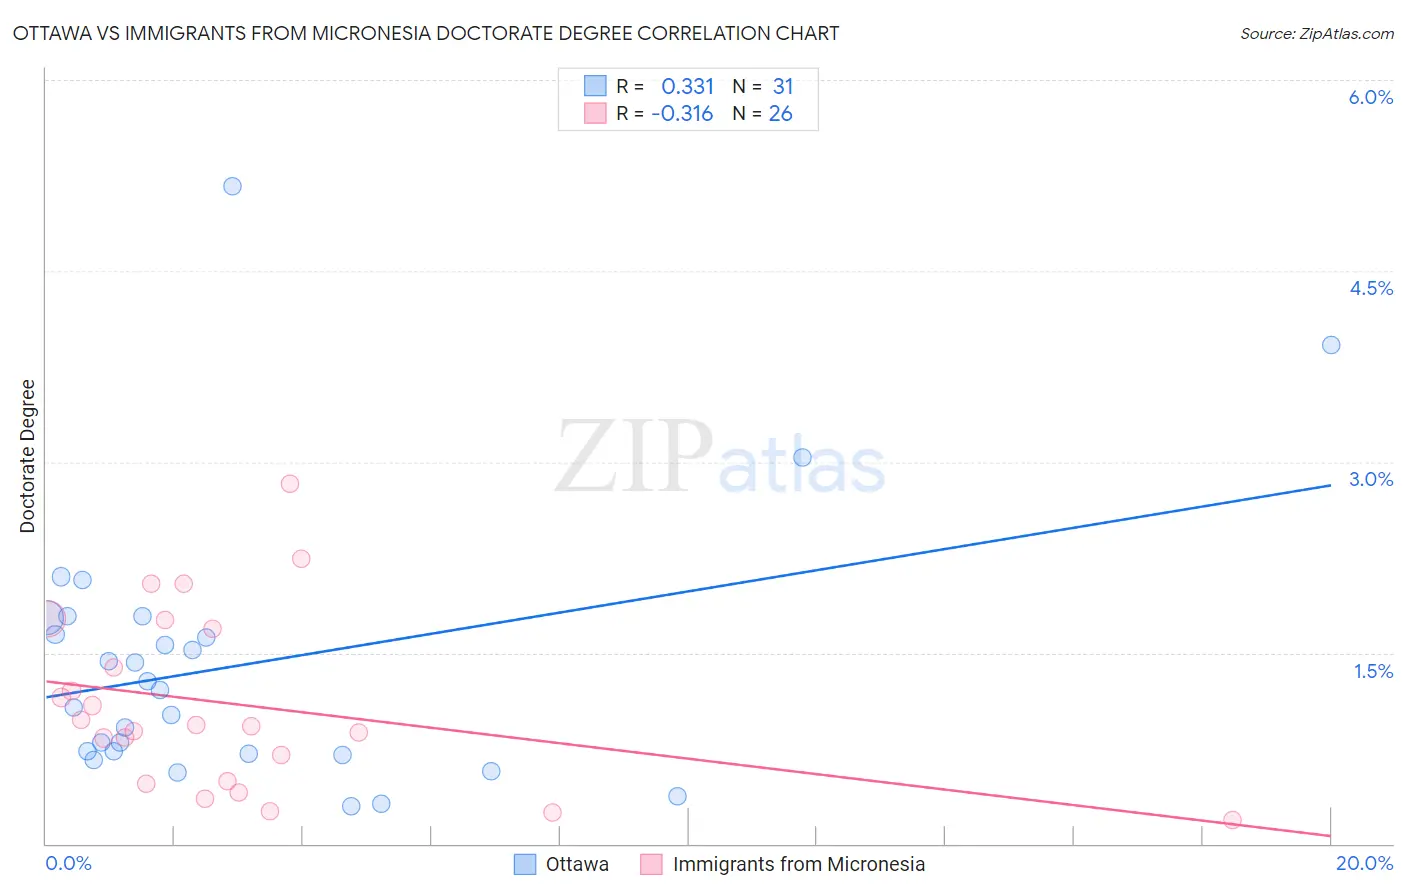
Ottawa vs Immigrants from Micronesia Doctorate Degree Correlation Chart
The statistical analysis conducted on geographies consisting of 49,607,860 people shows a mild positive correlation between the proportion of Ottawa and percentage of population with at least doctorate degree education in the United States with a correlation coefficient (R) of 0.331 and weighted average of 1.6%. Similarly, the statistical analysis conducted on geographies consisting of 61,316,353 people shows a mild negative correlation between the proportion of Immigrants from Micronesia and percentage of population with at least doctorate degree education in the United States with a correlation coefficient (R) of -0.316 and weighted average of 1.3%, a difference of 17.5%.
Doctorate Degree Correlation Summary
| Measurement | Ottawa | Immigrants from Micronesia |
| Minimum | 0.29% | 0.19% |
| Maximum | 5.2% | 2.8% |
| Range | 4.9% | 2.6% |
| Mean | 1.4% | 1.1% |
| Median | 1.2% | 0.93% |
| Interquartile 25% (IQ1) | 0.70% | 0.49% |
| Interquartile 75% (IQ3) | 1.8% | 1.7% |
| Interquartile Range (IQR) | 1.1% | 1.2% |
| Standard Deviation (Sample) | 1.1% | 0.69% |
| Standard Deviation (Population) | 1.0% | 0.68% |
Similar Demographics by Doctorate Degree
Demographics Similar to Ottawa by Doctorate Degree
In terms of doctorate degree, the demographic groups most similar to Ottawa are Native Hawaiian (1.6%, a difference of 0.13%), Cheyenne (1.6%, a difference of 0.21%), French American Indian (1.6%, a difference of 0.32%), Immigrants from Panama (1.6%, a difference of 0.40%), and West Indian (1.6%, a difference of 0.59%).
| Demographics | Rating | Rank | Doctorate Degree |
| Cree | 3.0 /100 | #235 | Tragic 1.6% |
| Indonesians | 2.8 /100 | #236 | Tragic 1.6% |
| Iroquois | 2.7 /100 | #237 | Tragic 1.6% |
| Immigrants | Congo | 2.6 /100 | #238 | Tragic 1.6% |
| West Indians | 2.5 /100 | #239 | Tragic 1.6% |
| Immigrants | Panama | 2.4 /100 | #240 | Tragic 1.6% |
| Cheyenne | 2.3 /100 | #241 | Tragic 1.6% |
| Ottawa | 2.2 /100 | #242 | Tragic 1.6% |
| Native Hawaiians | 2.1 /100 | #243 | Tragic 1.6% |
| French American Indians | 2.0 /100 | #244 | Tragic 1.6% |
| Delaware | 1.9 /100 | #245 | Tragic 1.6% |
| Hmong | 1.8 /100 | #246 | Tragic 1.6% |
| Comanche | 1.8 /100 | #247 | Tragic 1.6% |
| Africans | 1.8 /100 | #248 | Tragic 1.6% |
| Potawatomi | 1.6 /100 | #249 | Tragic 1.6% |
Demographics Similar to Immigrants from Micronesia by Doctorate Degree
In terms of doctorate degree, the demographic groups most similar to Immigrants from Micronesia are Creek (1.3%, a difference of 0.050%), Navajo (1.4%, a difference of 0.25%), Immigrants from the Azores (1.4%, a difference of 0.45%), Dominican (1.4%, a difference of 0.48%), and Menominee (1.4%, a difference of 0.55%).
| Demographics | Rating | Rank | Doctorate Degree |
| Immigrants | Jamaica | 0.1 /100 | #310 | Tragic 1.4% |
| Immigrants | Honduras | 0.1 /100 | #311 | Tragic 1.4% |
| Immigrants | Nicaragua | 0.1 /100 | #312 | Tragic 1.4% |
| Menominee | 0.1 /100 | #313 | Tragic 1.4% |
| Dominicans | 0.1 /100 | #314 | Tragic 1.4% |
| Immigrants | Azores | 0.1 /100 | #315 | Tragic 1.4% |
| Navajo | 0.1 /100 | #316 | Tragic 1.4% |
| Immigrants | Micronesia | 0.1 /100 | #317 | Tragic 1.3% |
| Creek | 0.1 /100 | #318 | Tragic 1.3% |
| Immigrants | Guyana | 0.1 /100 | #319 | Tragic 1.3% |
| Immigrants | St. Vincent and the Grenadines | 0.1 /100 | #320 | Tragic 1.3% |
| Dutch West Indians | 0.1 /100 | #321 | Tragic 1.3% |
| Seminole | 0.1 /100 | #322 | Tragic 1.3% |
| Immigrants | Belize | 0.1 /100 | #323 | Tragic 1.3% |
| Natives/Alaskans | 0.0 /100 | #324 | Tragic 1.3% |