Estonian vs Immigrants from El Salvador Doctorate Degree
COMPARE
Estonian
Immigrants from El Salvador
Doctorate Degree
Doctorate Degree Comparison
Estonians
Immigrants from El Salvador
2.5%
DOCTORATE DEGREE
100.0/ 100
METRIC RATING
40th/ 347
METRIC RANK
1.4%
DOCTORATE DEGREE
0.3/ 100
METRIC RATING
288th/ 347
METRIC RANK
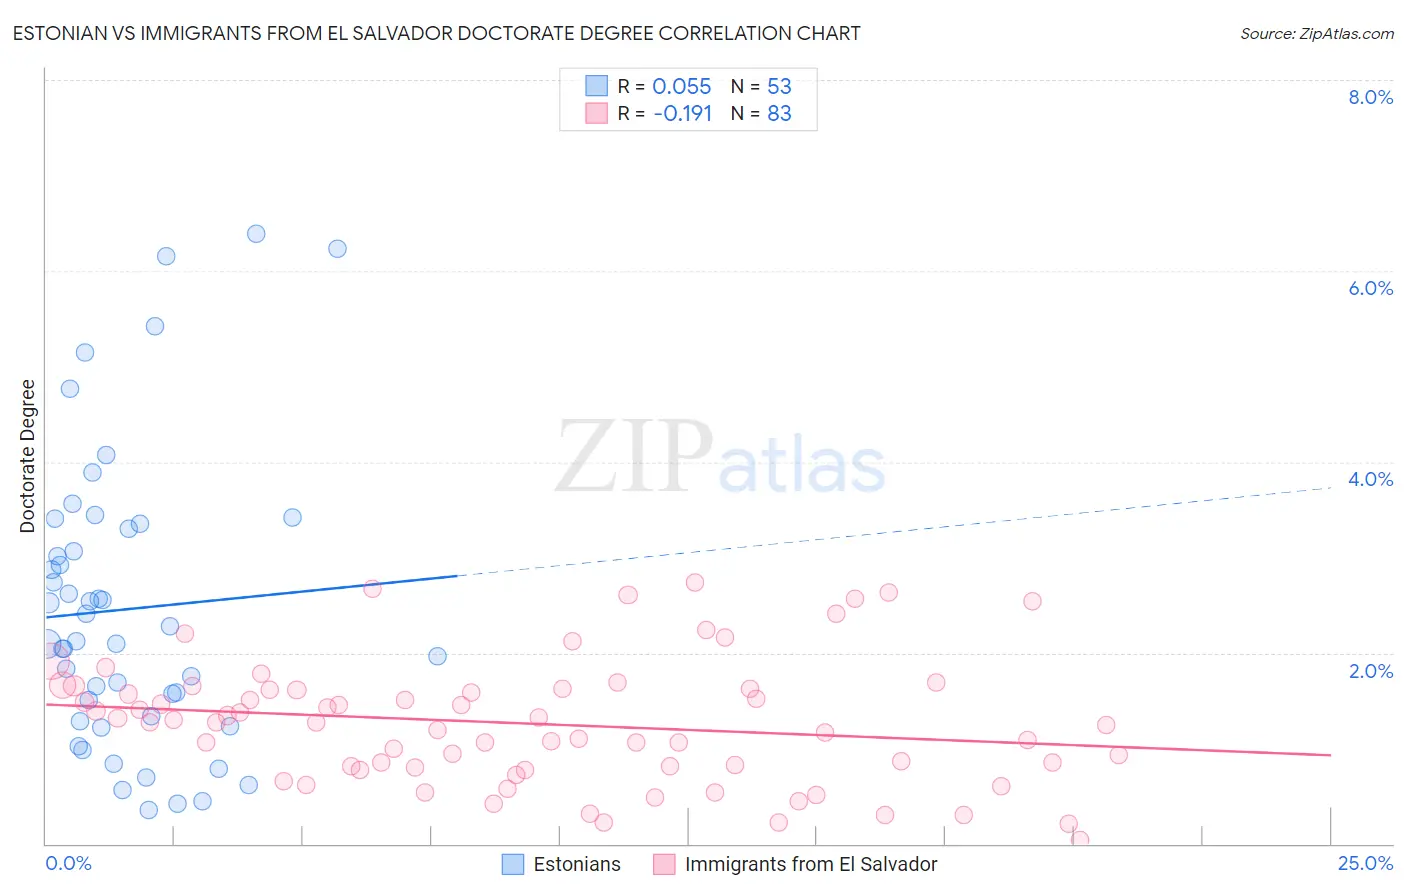
Estonian vs Immigrants from El Salvador Doctorate Degree Correlation Chart
The statistical analysis conducted on geographies consisting of 123,266,987 people shows a slight positive correlation between the proportion of Estonians and percentage of population with at least doctorate degree education in the United States with a correlation coefficient (R) of 0.055 and weighted average of 2.5%. Similarly, the statistical analysis conducted on geographies consisting of 353,263,202 people shows a poor negative correlation between the proportion of Immigrants from El Salvador and percentage of population with at least doctorate degree education in the United States with a correlation coefficient (R) of -0.191 and weighted average of 1.4%, a difference of 74.6%.
Doctorate Degree Correlation Summary
| Measurement | Estonian | Immigrants from El Salvador |
| Minimum | 0.36% | 0.038% |
| Maximum | 6.4% | 2.7% |
| Range | 6.0% | 2.7% |
| Mean | 2.5% | 1.3% |
| Median | 2.1% | 1.3% |
| Interquartile 25% (IQ1) | 1.3% | 0.80% |
| Interquartile 75% (IQ3) | 3.3% | 1.6% |
| Interquartile Range (IQR) | 2.0% | 0.82% |
| Standard Deviation (Sample) | 1.5% | 0.65% |
| Standard Deviation (Population) | 1.5% | 0.64% |
Similar Demographics by Doctorate Degree
Demographics Similar to Estonians by Doctorate Degree
In terms of doctorate degree, the demographic groups most similar to Estonians are Immigrants from Russia (2.5%, a difference of 0.33%), Immigrants from Ireland (2.5%, a difference of 0.41%), Russian (2.6%, a difference of 0.91%), New Zealander (2.5%, a difference of 0.96%), and Immigrants from Kuwait (2.6%, a difference of 1.1%).
| Demographics | Rating | Rank | Doctorate Degree |
| Cambodians | 100.0 /100 | #33 | Exceptional 2.6% |
| Cypriots | 100.0 /100 | #34 | Exceptional 2.6% |
| Immigrants | Malaysia | 100.0 /100 | #35 | Exceptional 2.6% |
| Immigrants | Spain | 100.0 /100 | #36 | Exceptional 2.6% |
| Immigrants | Kuwait | 100.0 /100 | #37 | Exceptional 2.6% |
| Russians | 100.0 /100 | #38 | Exceptional 2.6% |
| Immigrants | Ireland | 100.0 /100 | #39 | Exceptional 2.5% |
| Estonians | 100.0 /100 | #40 | Exceptional 2.5% |
| Immigrants | Russia | 100.0 /100 | #41 | Exceptional 2.5% |
| New Zealanders | 100.0 /100 | #42 | Exceptional 2.5% |
| Soviet Union | 100.0 /100 | #43 | Exceptional 2.5% |
| Immigrants | Netherlands | 100.0 /100 | #44 | Exceptional 2.5% |
| Immigrants | South Africa | 100.0 /100 | #45 | Exceptional 2.4% |
| Immigrants | Austria | 100.0 /100 | #46 | Exceptional 2.4% |
| Immigrants | Western Europe | 100.0 /100 | #47 | Exceptional 2.4% |
Demographics Similar to Immigrants from El Salvador by Doctorate Degree
In terms of doctorate degree, the demographic groups most similar to Immigrants from El Salvador are Cape Verdean (1.4%, a difference of 0.14%), Choctaw (1.4%, a difference of 0.15%), Cajun (1.5%, a difference of 0.18%), Cherokee (1.5%, a difference of 0.34%), and Black/African American (1.4%, a difference of 0.38%).
| Demographics | Rating | Rank | Doctorate Degree |
| Tohono O'odham | 0.4 /100 | #281 | Tragic 1.5% |
| British West Indians | 0.3 /100 | #282 | Tragic 1.5% |
| Central Americans | 0.3 /100 | #283 | Tragic 1.5% |
| Jamaicans | 0.3 /100 | #284 | Tragic 1.5% |
| Malaysians | 0.3 /100 | #285 | Tragic 1.5% |
| Cherokee | 0.3 /100 | #286 | Tragic 1.5% |
| Cajuns | 0.3 /100 | #287 | Tragic 1.5% |
| Immigrants | El Salvador | 0.3 /100 | #288 | Tragic 1.4% |
| Cape Verdeans | 0.3 /100 | #289 | Tragic 1.4% |
| Choctaw | 0.3 /100 | #290 | Tragic 1.4% |
| Blacks/African Americans | 0.3 /100 | #291 | Tragic 1.4% |
| Alaska Natives | 0.3 /100 | #292 | Tragic 1.4% |
| Immigrants | Yemen | 0.2 /100 | #293 | Tragic 1.4% |
| Samoans | 0.2 /100 | #294 | Tragic 1.4% |
| Guatemalans | 0.2 /100 | #295 | Tragic 1.4% |