English vs Scandinavian College, Under 1 year
COMPARE
English
Scandinavian
College, Under 1 year
College, Under 1 year Comparison
English
Scandinavians
66.6%
COLLEGE, UNDER 1 YEAR
82.9/ 100
METRIC RATING
142nd/ 347
METRIC RANK
67.7%
COLLEGE, UNDER 1 YEAR
95.8/ 100
METRIC RATING
109th/ 347
METRIC RANK
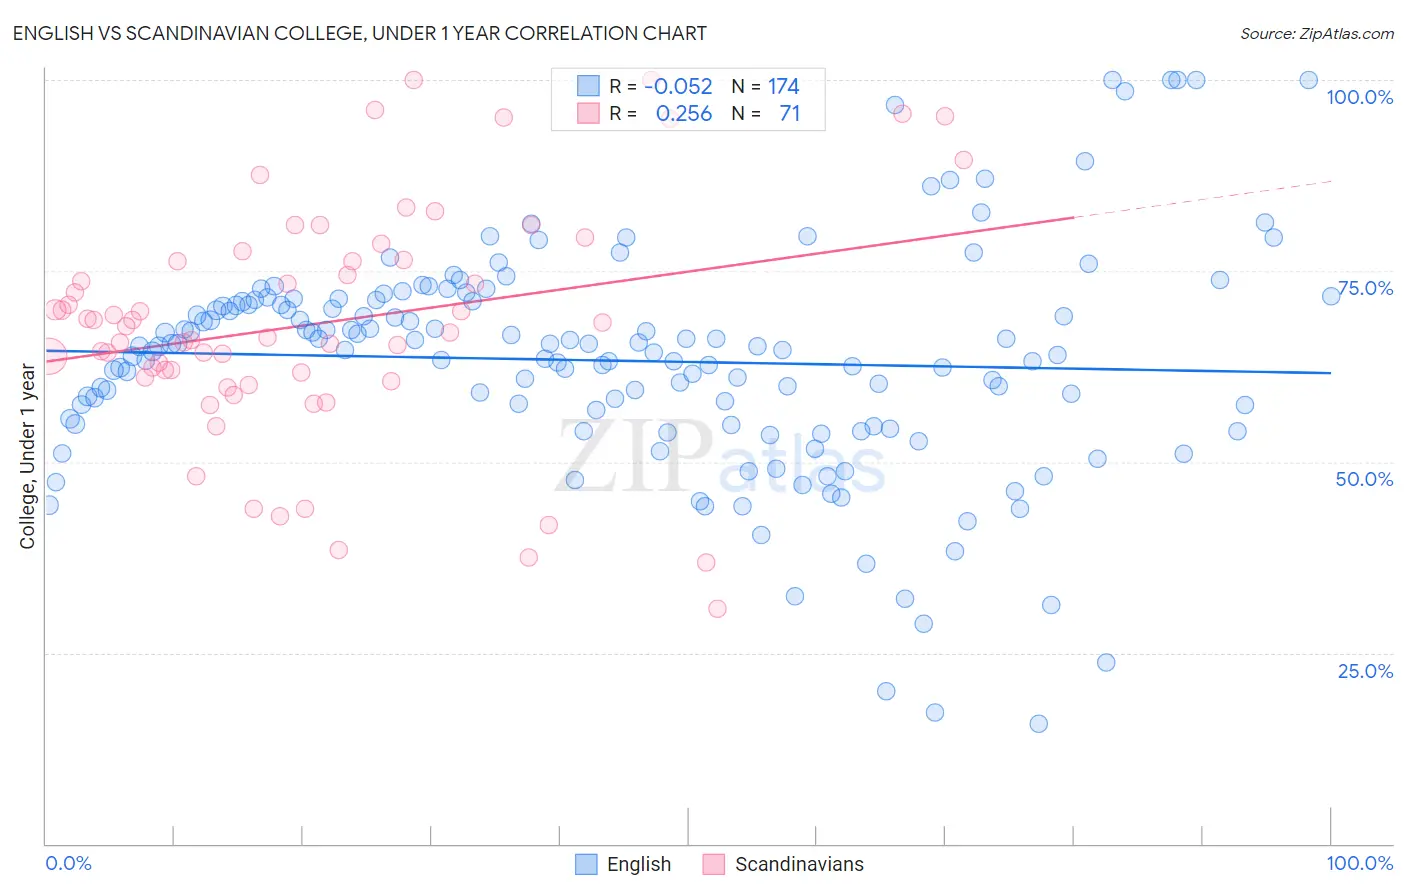
English vs Scandinavian College, Under 1 year Correlation Chart
The statistical analysis conducted on geographies consisting of 579,966,424 people shows a slight negative correlation between the proportion of English and percentage of population with at least college, under 1 year education in the United States with a correlation coefficient (R) of -0.052 and weighted average of 66.6%. Similarly, the statistical analysis conducted on geographies consisting of 472,657,876 people shows a weak positive correlation between the proportion of Scandinavians and percentage of population with at least college, under 1 year education in the United States with a correlation coefficient (R) of 0.256 and weighted average of 67.7%, a difference of 1.7%.
College, Under 1 year Correlation Summary
| Measurement | English | Scandinavian |
| Minimum | 15.7% | 30.8% |
| Maximum | 100.0% | 100.0% |
| Range | 84.3% | 69.2% |
| Mean | 63.3% | 68.2% |
| Median | 64.9% | 67.8% |
| Interquartile 25% (IQ1) | 55.0% | 61.1% |
| Interquartile 75% (IQ3) | 71.0% | 76.4% |
| Interquartile Range (IQR) | 16.0% | 15.3% |
| Standard Deviation (Sample) | 14.9% | 15.3% |
| Standard Deviation (Population) | 14.8% | 15.2% |
Similar Demographics by College, Under 1 year
Demographics Similar to English by College, Under 1 year
In terms of college, under 1 year, the demographic groups most similar to English are Immigrants from Uganda (66.5%, a difference of 0.010%), Immigrants from Germany (66.5%, a difference of 0.070%), Immigrants from Kenya (66.5%, a difference of 0.090%), Kenyan (66.5%, a difference of 0.090%), and Immigrants from Morocco (66.5%, a difference of 0.090%).
| Demographics | Rating | Rank | College, Under 1 year |
| Canadians | 87.9 /100 | #135 | Excellent 66.8% |
| Ugandans | 87.8 /100 | #136 | Excellent 66.8% |
| Immigrants | Chile | 87.4 /100 | #137 | Excellent 66.8% |
| Immigrants | Italy | 86.9 /100 | #138 | Excellent 66.8% |
| Venezuelans | 85.9 /100 | #139 | Excellent 66.7% |
| Slavs | 85.9 /100 | #140 | Excellent 66.7% |
| Immigrants | Afghanistan | 85.1 /100 | #141 | Excellent 66.7% |
| English | 82.9 /100 | #142 | Excellent 66.6% |
| Immigrants | Uganda | 82.8 /100 | #143 | Excellent 66.5% |
| Immigrants | Germany | 82.0 /100 | #144 | Excellent 66.5% |
| Immigrants | Kenya | 81.8 /100 | #145 | Excellent 66.5% |
| Kenyans | 81.7 /100 | #146 | Excellent 66.5% |
| Immigrants | Morocco | 81.7 /100 | #147 | Excellent 66.5% |
| Taiwanese | 78.6 /100 | #148 | Good 66.4% |
| Immigrants | Venezuela | 77.9 /100 | #149 | Good 66.3% |
Demographics Similar to Scandinavians by College, Under 1 year
In terms of college, under 1 year, the demographic groups most similar to Scandinavians are Assyrian/Chaldean/Syriac (67.7%, a difference of 0.0%), Ukrainian (67.7%, a difference of 0.0%), Macedonian (67.6%, a difference of 0.020%), Syrian (67.6%, a difference of 0.050%), and Immigrants from Egypt (67.7%, a difference of 0.060%).
| Demographics | Rating | Rank | College, Under 1 year |
| Palestinians | 96.9 /100 | #102 | Exceptional 67.9% |
| Carpatho Rusyns | 96.8 /100 | #103 | Exceptional 67.9% |
| Immigrants | Western Asia | 96.6 /100 | #104 | Exceptional 67.8% |
| Afghans | 96.6 /100 | #105 | Exceptional 67.8% |
| Immigrants | Croatia | 96.6 /100 | #106 | Exceptional 67.8% |
| Austrians | 96.4 /100 | #107 | Exceptional 67.8% |
| Immigrants | Egypt | 96.0 /100 | #108 | Exceptional 67.7% |
| Scandinavians | 95.8 /100 | #109 | Exceptional 67.7% |
| Assyrians/Chaldeans/Syriacs | 95.8 /100 | #110 | Exceptional 67.7% |
| Ukrainians | 95.8 /100 | #111 | Exceptional 67.7% |
| Macedonians | 95.7 /100 | #112 | Exceptional 67.6% |
| Syrians | 95.6 /100 | #113 | Exceptional 67.6% |
| Chileans | 95.3 /100 | #114 | Exceptional 67.6% |
| Basques | 95.2 /100 | #115 | Exceptional 67.6% |
| Immigrants | Nepal | 94.9 /100 | #116 | Exceptional 67.5% |