English vs Immigrants from Vietnam Median Household Income
COMPARE
English
Immigrants from Vietnam
Median Household Income
Median Household Income Comparison
English
Immigrants from Vietnam
$84,915
MEDIAN HOUSEHOLD INCOME
47.0/ 100
METRIC RATING
179th/ 347
METRIC RANK
$91,987
MEDIAN HOUSEHOLD INCOME
98.8/ 100
METRIC RATING
91st/ 347
METRIC RANK
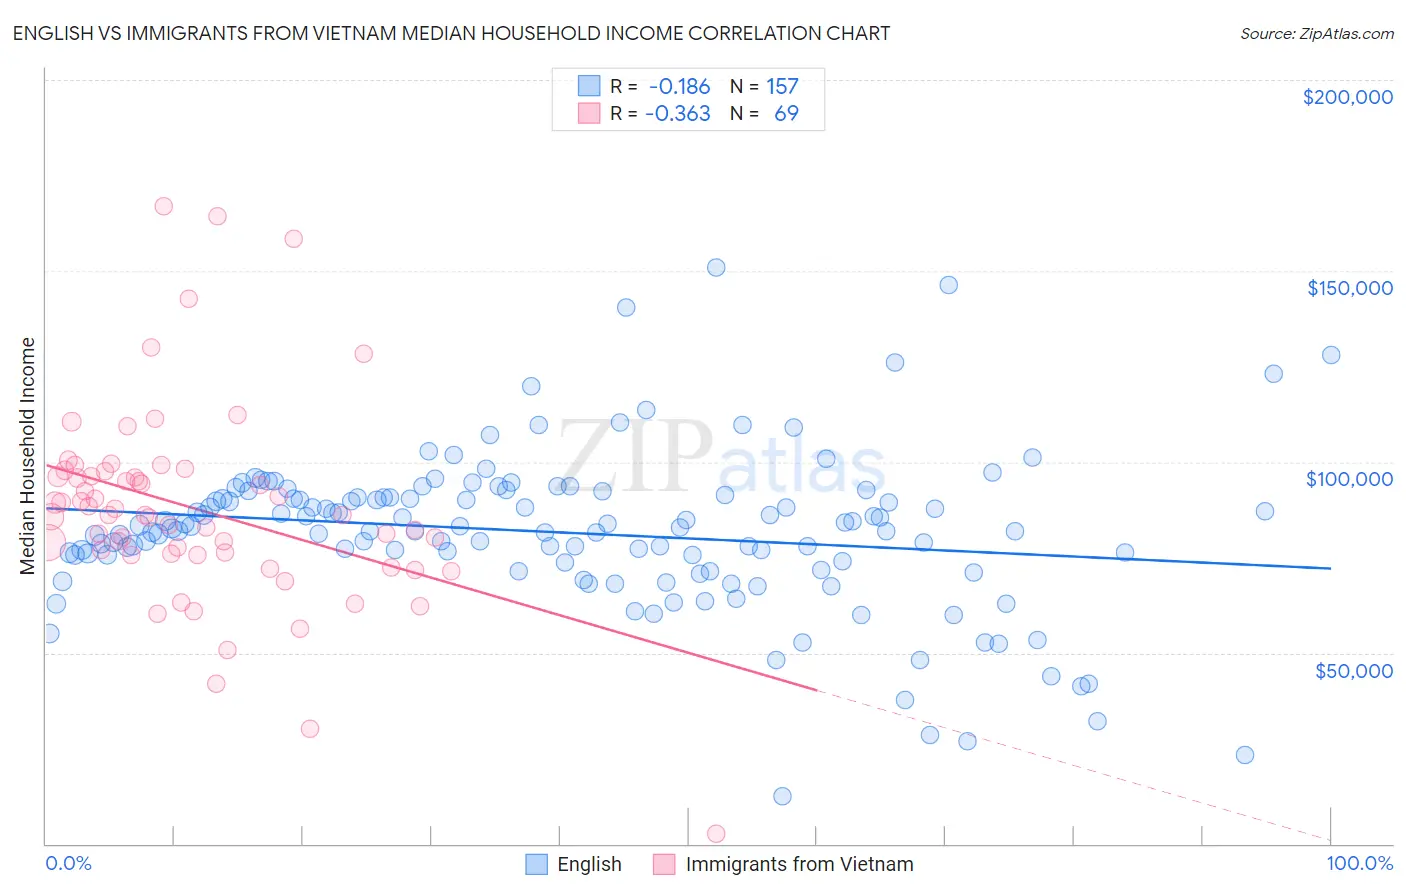
English vs Immigrants from Vietnam Median Household Income Correlation Chart
The statistical analysis conducted on geographies consisting of 578,383,901 people shows a poor negative correlation between the proportion of English and median household income in the United States with a correlation coefficient (R) of -0.186 and weighted average of $84,915. Similarly, the statistical analysis conducted on geographies consisting of 404,446,933 people shows a mild negative correlation between the proportion of Immigrants from Vietnam and median household income in the United States with a correlation coefficient (R) of -0.363 and weighted average of $91,987, a difference of 8.3%.
Median Household Income Correlation Summary
| Measurement | English | Immigrants from Vietnam |
| Minimum | $12,326 | $2,499 |
| Maximum | $150,805 | $166,850 |
| Range | $138,479 | $164,351 |
| Mean | $81,510 | $87,664 |
| Median | $82,609 | $86,139 |
| Interquartile 25% (IQ1) | $73,869 | $75,826 |
| Interquartile 75% (IQ3) | $90,807 | $96,947 |
| Interquartile Range (IQR) | $16,938 | $21,121 |
| Standard Deviation (Sample) | $20,635 | $26,629 |
| Standard Deviation (Population) | $20,569 | $26,435 |
Similar Demographics by Median Household Income
Demographics Similar to English by Median Household Income
In terms of median household income, the demographic groups most similar to English are Czechoslovakian ($84,965, a difference of 0.060%), Immigrants from Eritrea ($85,025, a difference of 0.13%), Immigrants from Costa Rica ($85,054, a difference of 0.16%), Alsatian ($85,053, a difference of 0.16%), and Immigrants from Portugal ($84,740, a difference of 0.21%).
| Demographics | Rating | Rank | Median Household Income |
| Slovenes | 57.4 /100 | #172 | Average $85,562 |
| Immigrants | Cameroon | 53.4 /100 | #173 | Average $85,314 |
| Scottish | 50.0 /100 | #174 | Average $85,101 |
| Immigrants | Costa Rica | 49.2 /100 | #175 | Average $85,054 |
| Alsatians | 49.2 /100 | #176 | Average $85,053 |
| Immigrants | Eritrea | 48.8 /100 | #177 | Average $85,025 |
| Czechoslovakians | 47.8 /100 | #178 | Average $84,965 |
| English | 47.0 /100 | #179 | Average $84,915 |
| Immigrants | Portugal | 44.2 /100 | #180 | Average $84,740 |
| Hawaiians | 44.1 /100 | #181 | Average $84,729 |
| Uruguayans | 43.5 /100 | #182 | Average $84,691 |
| Spaniards | 42.7 /100 | #183 | Average $84,644 |
| Immigrants | Eastern Africa | 37.4 /100 | #184 | Fair $84,299 |
| Kenyans | 34.2 /100 | #185 | Fair $84,085 |
| Puget Sound Salish | 33.2 /100 | #186 | Fair $84,011 |
Demographics Similar to Immigrants from Vietnam by Median Household Income
In terms of median household income, the demographic groups most similar to Immigrants from Vietnam are Assyrian/Chaldean/Syriac ($91,991, a difference of 0.0%), Romanian ($91,994, a difference of 0.010%), Immigrants from Canada ($92,029, a difference of 0.050%), Immigrants from Western Europe ($91,936, a difference of 0.060%), and Immigrants from Lebanon ($91,887, a difference of 0.11%).
| Demographics | Rating | Rank | Median Household Income |
| Immigrants | Argentina | 99.1 /100 | #84 | Exceptional $92,417 |
| Immigrants | Croatia | 99.0 /100 | #85 | Exceptional $92,225 |
| Immigrants | England | 98.9 /100 | #86 | Exceptional $92,098 |
| Immigrants | Hungary | 98.9 /100 | #87 | Exceptional $92,094 |
| Immigrants | Canada | 98.8 /100 | #88 | Exceptional $92,029 |
| Romanians | 98.8 /100 | #89 | Exceptional $91,994 |
| Assyrians/Chaldeans/Syriacs | 98.8 /100 | #90 | Exceptional $91,991 |
| Immigrants | Vietnam | 98.8 /100 | #91 | Exceptional $91,987 |
| Immigrants | Western Europe | 98.8 /100 | #92 | Exceptional $91,936 |
| Immigrants | Lebanon | 98.7 /100 | #93 | Exceptional $91,887 |
| Immigrants | North America | 98.7 /100 | #94 | Exceptional $91,860 |
| Armenians | 98.7 /100 | #95 | Exceptional $91,807 |
| Jordanians | 98.7 /100 | #96 | Exceptional $91,794 |
| Immigrants | Serbia | 98.6 /100 | #97 | Exceptional $91,730 |
| Immigrants | Southern Europe | 98.5 /100 | #98 | Exceptional $91,605 |