English vs Immigrants from Ethiopia College, Under 1 year
COMPARE
English
Immigrants from Ethiopia
College, Under 1 year
College, Under 1 year Comparison
English
Immigrants from Ethiopia
66.6%
COLLEGE, UNDER 1 YEAR
82.9/ 100
METRIC RATING
142nd/ 347
METRIC RANK
68.0%
COLLEGE, UNDER 1 YEAR
97.3/ 100
METRIC RATING
97th/ 347
METRIC RANK
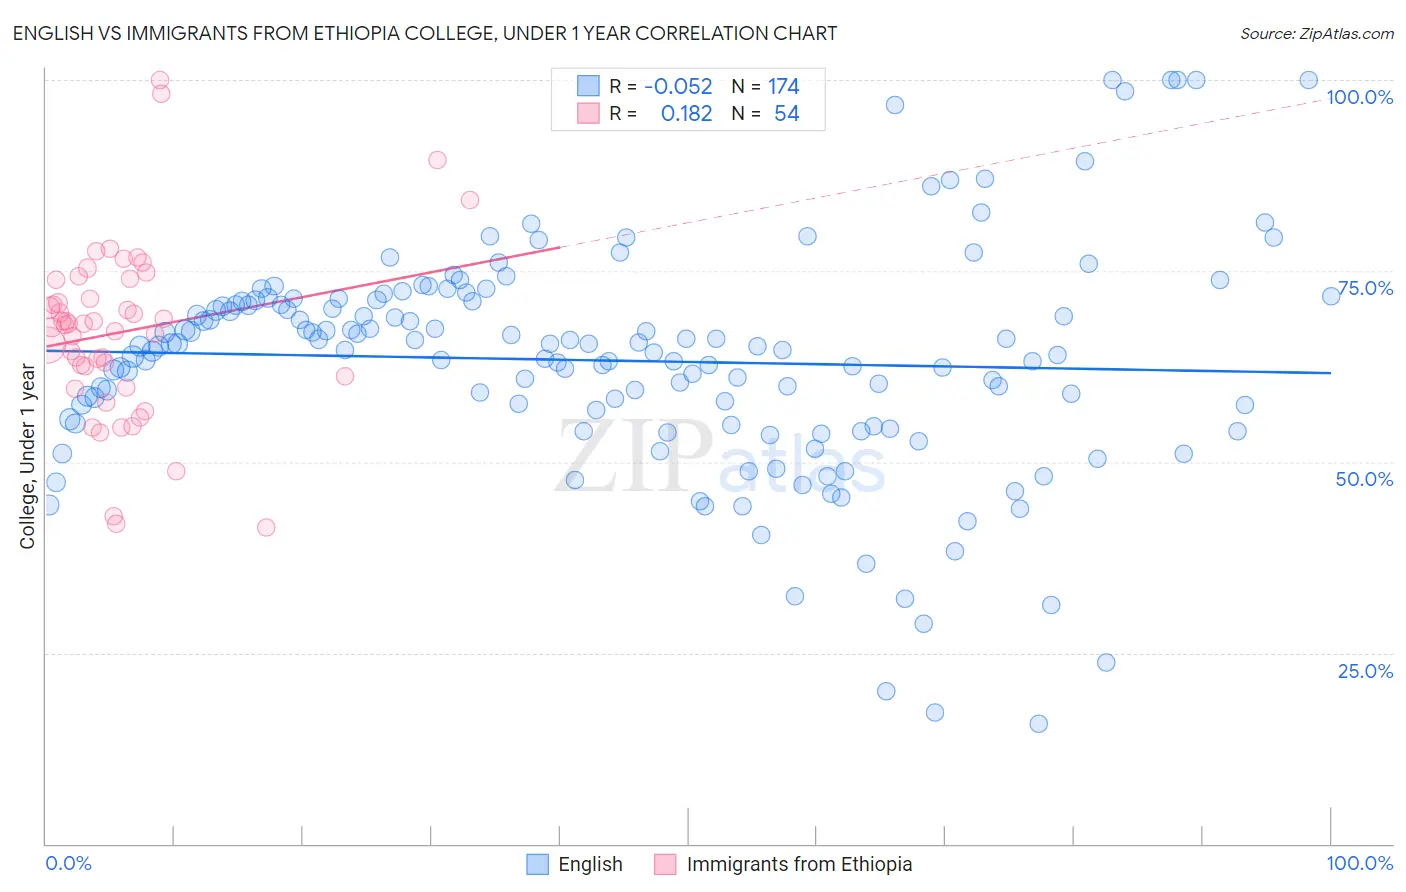
English vs Immigrants from Ethiopia College, Under 1 year Correlation Chart
The statistical analysis conducted on geographies consisting of 579,966,424 people shows a slight negative correlation between the proportion of English and percentage of population with at least college, under 1 year education in the United States with a correlation coefficient (R) of -0.052 and weighted average of 66.6%. Similarly, the statistical analysis conducted on geographies consisting of 211,551,932 people shows a poor positive correlation between the proportion of Immigrants from Ethiopia and percentage of population with at least college, under 1 year education in the United States with a correlation coefficient (R) of 0.182 and weighted average of 68.0%, a difference of 2.2%.
College, Under 1 year Correlation Summary
| Measurement | English | Immigrants from Ethiopia |
| Minimum | 15.7% | 41.4% |
| Maximum | 100.0% | 100.0% |
| Range | 84.3% | 58.6% |
| Mean | 63.3% | 67.0% |
| Median | 64.9% | 68.0% |
| Interquartile 25% (IQ1) | 55.0% | 61.1% |
| Interquartile 75% (IQ3) | 71.0% | 73.8% |
| Interquartile Range (IQR) | 16.0% | 12.6% |
| Standard Deviation (Sample) | 14.9% | 11.6% |
| Standard Deviation (Population) | 14.8% | 11.5% |
Similar Demographics by College, Under 1 year
Demographics Similar to English by College, Under 1 year
In terms of college, under 1 year, the demographic groups most similar to English are Immigrants from Uganda (66.5%, a difference of 0.010%), Immigrants from Germany (66.5%, a difference of 0.070%), Immigrants from Kenya (66.5%, a difference of 0.090%), Kenyan (66.5%, a difference of 0.090%), and Immigrants from Morocco (66.5%, a difference of 0.090%).
| Demographics | Rating | Rank | College, Under 1 year |
| Canadians | 87.9 /100 | #135 | Excellent 66.8% |
| Ugandans | 87.8 /100 | #136 | Excellent 66.8% |
| Immigrants | Chile | 87.4 /100 | #137 | Excellent 66.8% |
| Immigrants | Italy | 86.9 /100 | #138 | Excellent 66.8% |
| Venezuelans | 85.9 /100 | #139 | Excellent 66.7% |
| Slavs | 85.9 /100 | #140 | Excellent 66.7% |
| Immigrants | Afghanistan | 85.1 /100 | #141 | Excellent 66.7% |
| English | 82.9 /100 | #142 | Excellent 66.6% |
| Immigrants | Uganda | 82.8 /100 | #143 | Excellent 66.5% |
| Immigrants | Germany | 82.0 /100 | #144 | Excellent 66.5% |
| Immigrants | Kenya | 81.8 /100 | #145 | Excellent 66.5% |
| Kenyans | 81.7 /100 | #146 | Excellent 66.5% |
| Immigrants | Morocco | 81.7 /100 | #147 | Excellent 66.5% |
| Taiwanese | 78.6 /100 | #148 | Good 66.4% |
| Immigrants | Venezuela | 77.9 /100 | #149 | Good 66.3% |
Demographics Similar to Immigrants from Ethiopia by College, Under 1 year
In terms of college, under 1 year, the demographic groups most similar to Immigrants from Ethiopia are Jordanian (68.0%, a difference of 0.030%), Immigrants from Pakistan (68.0%, a difference of 0.060%), Paraguayan (67.9%, a difference of 0.10%), Immigrants from Bolivia (67.9%, a difference of 0.12%), and Immigrants from Argentina (67.9%, a difference of 0.13%).
| Demographics | Rating | Rank | College, Under 1 year |
| Icelanders | 98.1 /100 | #90 | Exceptional 68.3% |
| Europeans | 98.1 /100 | #91 | Exceptional 68.2% |
| Luxembourgers | 98.1 /100 | #92 | Exceptional 68.2% |
| Romanians | 97.9 /100 | #93 | Exceptional 68.2% |
| Armenians | 97.7 /100 | #94 | Exceptional 68.1% |
| Immigrants | Pakistan | 97.5 /100 | #95 | Exceptional 68.0% |
| Jordanians | 97.4 /100 | #96 | Exceptional 68.0% |
| Immigrants | Ethiopia | 97.3 /100 | #97 | Exceptional 68.0% |
| Paraguayans | 97.1 /100 | #98 | Exceptional 67.9% |
| Immigrants | Bolivia | 97.0 /100 | #99 | Exceptional 67.9% |
| Immigrants | Argentina | 97.0 /100 | #100 | Exceptional 67.9% |
| Immigrants | Eastern Europe | 96.9 /100 | #101 | Exceptional 67.9% |
| Palestinians | 96.9 /100 | #102 | Exceptional 67.9% |
| Carpatho Rusyns | 96.8 /100 | #103 | Exceptional 67.9% |
| Immigrants | Western Asia | 96.6 /100 | #104 | Exceptional 67.8% |