Egyptian vs Immigrants from Cabo Verde Unemployment Among Seniors over 75 years
COMPARE
Egyptian
Immigrants from Cabo Verde
Unemployment Among Seniors over 75 years
Unemployment Among Seniors over 75 years Comparison
Egyptians
Immigrants from Cabo Verde
8.1%
UNEMPLOYMENT AMONG SENIORS OVER 75 YEARS
99.5/ 100
METRIC RATING
91st/ 347
METRIC RANK
12.3%
UNEMPLOYMENT AMONG SENIORS OVER 75 YEARS
0.0/ 100
METRIC RATING
338th/ 347
METRIC RANK
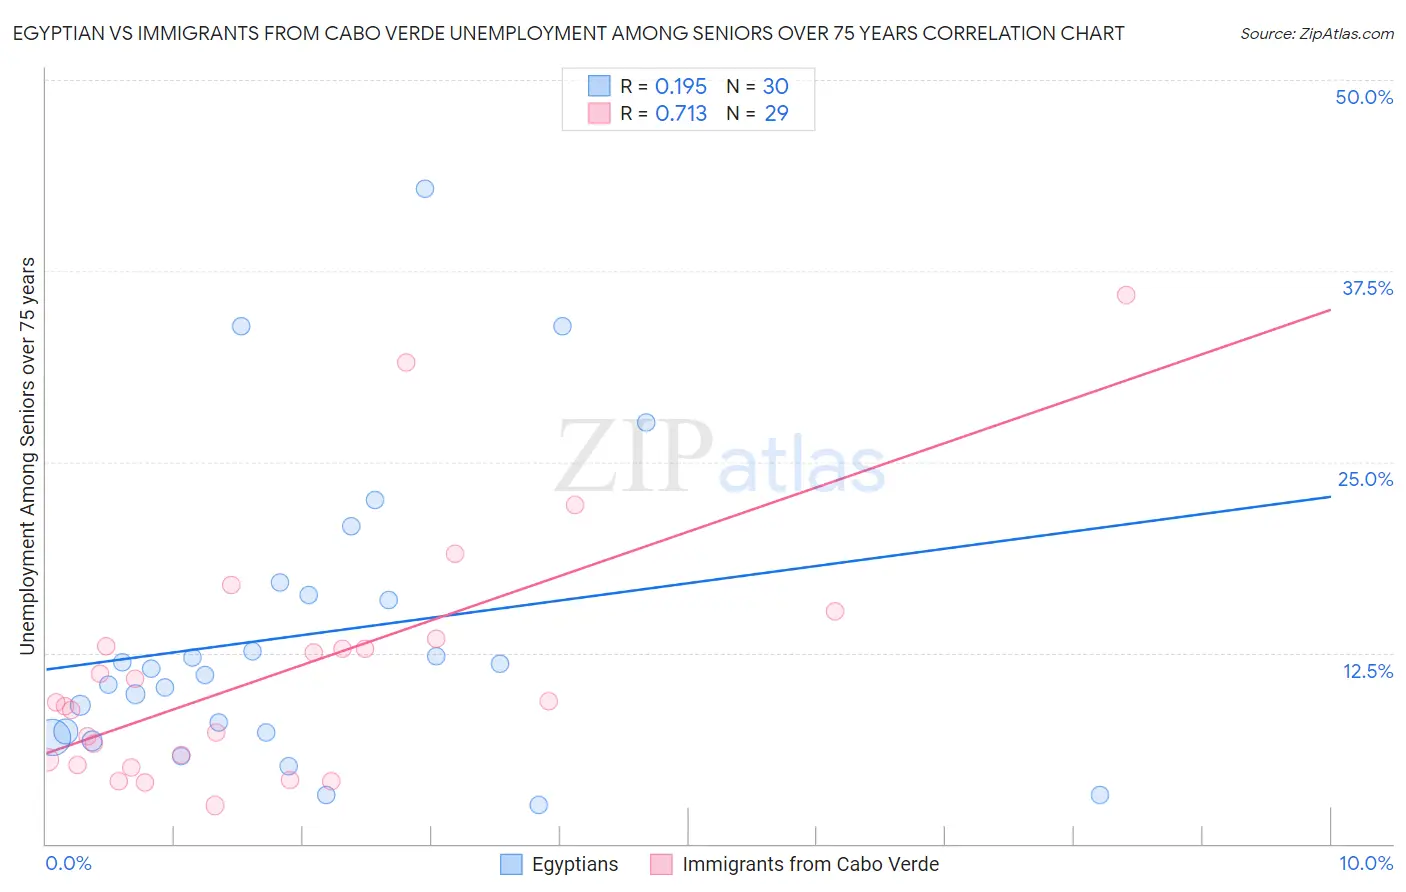
Egyptian vs Immigrants from Cabo Verde Unemployment Among Seniors over 75 years Correlation Chart
The statistical analysis conducted on geographies consisting of 164,384,297 people shows a poor positive correlation between the proportion of Egyptians and unemployment rate among seniors over the age of 75 in the United States with a correlation coefficient (R) of 0.195 and weighted average of 8.1%. Similarly, the statistical analysis conducted on geographies consisting of 29,962,388 people shows a strong positive correlation between the proportion of Immigrants from Cabo Verde and unemployment rate among seniors over the age of 75 in the United States with a correlation coefficient (R) of 0.713 and weighted average of 12.3%, a difference of 51.7%.
Unemployment Among Seniors over 75 years Correlation Summary
| Measurement | Egyptian | Immigrants from Cabo Verde |
| Minimum | 2.5% | 2.5% |
| Maximum | 42.9% | 35.9% |
| Range | 40.4% | 33.4% |
| Mean | 13.7% | 11.2% |
| Median | 11.2% | 9.2% |
| Interquartile 25% (IQ1) | 7.3% | 5.3% |
| Interquartile 75% (IQ3) | 16.3% | 13.2% |
| Interquartile Range (IQR) | 9.0% | 7.8% |
| Standard Deviation (Sample) | 9.8% | 7.9% |
| Standard Deviation (Population) | 9.6% | 7.8% |
Similar Demographics by Unemployment Among Seniors over 75 years
Demographics Similar to Egyptians by Unemployment Among Seniors over 75 years
In terms of unemployment among seniors over 75 years, the demographic groups most similar to Egyptians are Venezuelan (8.1%, a difference of 0.0%), Immigrants from Vietnam (8.1%, a difference of 0.040%), Immigrants from Netherlands (8.1%, a difference of 0.090%), Immigrants from Korea (8.1%, a difference of 0.12%), and Immigrants from Ireland (8.1%, a difference of 0.12%).
| Demographics | Rating | Rank | Unemployment Among Seniors over 75 years |
| U.S. Virgin Islanders | 99.7 /100 | #84 | Exceptional 8.1% |
| Immigrants | Indonesia | 99.7 /100 | #85 | Exceptional 8.1% |
| Immigrants | Singapore | 99.7 /100 | #86 | Exceptional 8.1% |
| Basques | 99.5 /100 | #87 | Exceptional 8.1% |
| New Zealanders | 99.5 /100 | #88 | Exceptional 8.1% |
| Immigrants | Korea | 99.5 /100 | #89 | Exceptional 8.1% |
| Immigrants | Vietnam | 99.5 /100 | #90 | Exceptional 8.1% |
| Egyptians | 99.5 /100 | #91 | Exceptional 8.1% |
| Venezuelans | 99.5 /100 | #92 | Exceptional 8.1% |
| Immigrants | Netherlands | 99.5 /100 | #93 | Exceptional 8.1% |
| Immigrants | Ireland | 99.4 /100 | #94 | Exceptional 8.1% |
| Nicaraguans | 99.3 /100 | #95 | Exceptional 8.2% |
| Immigrants | Belgium | 99.3 /100 | #96 | Exceptional 8.2% |
| Immigrants | Sri Lanka | 99.3 /100 | #97 | Exceptional 8.2% |
| Immigrants | Northern Africa | 99.3 /100 | #98 | Exceptional 8.2% |
Demographics Similar to Immigrants from Cabo Verde by Unemployment Among Seniors over 75 years
In terms of unemployment among seniors over 75 years, the demographic groups most similar to Immigrants from Cabo Verde are Cajun (12.5%, a difference of 1.3%), Yup'ik (12.8%, a difference of 3.5%), Cape Verdean (11.4%, a difference of 8.1%), Immigrants from North Macedonia (11.3%, a difference of 9.0%), and Lumbee (13.5%, a difference of 9.2%).
| Demographics | Rating | Rank | Unemployment Among Seniors over 75 years |
| Tohono O'odham | 0.0 /100 | #331 | Tragic 10.8% |
| Immigrants | Liberia | 0.0 /100 | #332 | Tragic 10.9% |
| Alaskan Athabascans | 0.0 /100 | #333 | Tragic 11.0% |
| Assyrians/Chaldeans/Syriacs | 0.0 /100 | #334 | Tragic 11.1% |
| French Canadians | 0.0 /100 | #335 | Tragic 11.2% |
| Immigrants | North Macedonia | 0.0 /100 | #336 | Tragic 11.3% |
| Cape Verdeans | 0.0 /100 | #337 | Tragic 11.4% |
| Immigrants | Cabo Verde | 0.0 /100 | #338 | Tragic 12.3% |
| Cajuns | 0.0 /100 | #339 | Tragic 12.5% |
| Yup'ik | 0.0 /100 | #340 | Tragic 12.8% |
| Lumbee | 0.0 /100 | #341 | Tragic 13.5% |
| Hmong | 0.0 /100 | #342 | Tragic 13.7% |
| Alaska Natives | 0.0 /100 | #343 | Tragic 14.7% |
| Immigrants | Yemen | 0.0 /100 | #344 | Tragic 16.5% |
| Yakama | 0.0 /100 | #345 | Tragic 18.4% |