Egyptian vs Immigrants from Western Africa Associate's Degree

COMPARE

Egyptian
Race
Ancestry
AfghanAfricanAlaska NativeAlaskan AthabascanAlbanianAleutAlsatianAmericanApacheArabArapahoArgentineanArmenianAssyrian/Chaldean/SyriacAustralianAustrianBahamianBangladeshiBarbadianBasqueBelgianBelizeanBermudanBhutaneseBlackfeetBolivianBrazilianBritishBritish West IndianBulgarianBurmeseCajunCambodianCanadianCape VerdeanCarpatho RusynCelticCentral AmericanCentral American IndianCherokeeCheyenneChickasawChileanChineseChippewaChoctawColombianColvilleComancheCosta RicanCreeCreekCroatianCrowCubanCypriotCzechCzechoslovakianDanishDelawareDominicanDutchDutch West IndianEastern EuropeanEcuadorianEgyptianEnglishEstonianEthiopianEuropeanFijianFilipinoFinnishFrenchFrench American IndianFrench CanadianGermanGerman RussianGhanaianGreekGuamanian/ChamorroGuatemalanGuyaneseHaitianHmongHonduranHopiHoumaHungarianIcelanderIndian (Asian)IndonesianInupiatIranianIraqiIrishIroquoisIsraeliItalianJamaicanJapaneseJordanianKenyanKiowaKoreanLaotianLatvianLebaneseLiberianLithuanianLumbeeLuxembourgerMacedonianMalaysianMalteseMarshalleseMenomineeMexicanMexican American IndianMongolianMoroccanNative HawaiianNavajoNepaleseNew ZealanderNicaraguanNigerianNorthern EuropeanNorwegianOkinawanOsageOttawaPaiutePakistaniPalestinianPanamanianParaguayanPennsylvania GermanPeruvianPimaPolishPortuguesePotawatomiPuebloPuerto RicanPuget Sound SalishRomanianRussianSalvadoranSamoanScandinavianScotch-IrishScottishSeminoleSenegaleseSerbianShoshoneSierra LeoneanSiouxSlavicSlovakSloveneSomaliSouth AfricanSouth AmericanSouth American IndianSoviet UnionSpaniardSpanishSpanish AmericanSpanish American IndianSri LankanSubsaharan AfricanSudaneseSwedishSwissSyrianTaiwaneseThaiTlingit-HaidaTohono O'OdhamTonganTrinidadian and TobagonianTsimshianTurkishU.S. Virgin IslanderUgandanUkrainianUruguayanUteVenezuelanVietnameseWelshWest IndianYakamaYaquiYugoslavianYumanYup'ikZimbabwean
Immigration
NonimmigrantsImmigrantsAfghanistanAfricaAlbaniaArgentinaArmeniaAsiaAustraliaAustriaBahamasBangladeshBarbadosBelarusBelgiumBelizeBoliviaBosnia and HerzegovinaBrazilBulgariaBurma/MyanmarCabo VerdeCambodiaCameroonCanadaCaribbeanCentral AmericaChileChinaColombiaCongoCosta RicaCroatiaCubaCzechoslovakiaDenmarkDominicaDominican RepublicEastern AfricaEastern AsiaEastern EuropeEcuadorEgyptEl SalvadorEnglandEritreaEthiopiaEuropeFijiFranceGermanyGhanaGreeceGrenadaGuatemalaGuyanaHaitiHondurasHong KongHungaryIndiaIndonesiaIranIraqIrelandIsraelItalyJamaicaJapanJordanKazakhstanKenyaKoreaKuwaitLaosLatin AmericaLatviaLebanonLiberiaLithuaniaMalaysiaMexicoMicronesiaMiddle AfricaMoldovaMoroccoNepalNetherlandsNicaraguaNigeriaNorth AmericaNorth MacedoniaNorthern AfricaNorthern EuropeNorwayOceaniaPakistanPanamaPeruPhilippinesPolandPortugalRomaniaRussiaSaudi ArabiaScotlandSenegalSerbiaSierra LeoneSingaporeSomaliaSouth AfricaSouth AmericaSouth Central AsiaSouth Eastern AsiaSouthern EuropeSpainSri LankaSt. Vincent and the GrenadinesSudanSwedenSwitzerlandSyriaTaiwanThailandTrinidad and TobagoTurkeyUgandaUkraineUruguayUzbekistanVenezuelaVietnamWest IndiesWestern AsiaWestern EuropeYemenZaireZimbabweAzores
Immigrants from Western Africa
Race
Ancestry
AfghanAfricanAlaska NativeAlaskan AthabascanAlbanianAleutAlsatianAmericanApacheArabArapahoArgentineanArmenianAssyrian/Chaldean/SyriacAustralianAustrianBahamianBangladeshiBarbadianBasqueBelgianBelizeanBermudanBhutaneseBlackfeetBolivianBrazilianBritishBritish West IndianBulgarianBurmeseCajunCambodianCanadianCape VerdeanCarpatho RusynCelticCentral AmericanCentral American IndianCherokeeCheyenneChickasawChileanChineseChippewaChoctawColombianColvilleComancheCosta RicanCreeCreekCroatianCrowCubanCypriotCzechCzechoslovakianDanishDelawareDominicanDutchDutch West IndianEastern EuropeanEcuadorianEnglishEstonianEthiopianEuropeanFijianFilipinoFinnishFrenchFrench American IndianFrench CanadianGermanGerman RussianGhanaianGreekGuamanian/ChamorroGuatemalanGuyaneseHaitianHmongHonduranHopiHoumaHungarianIcelanderIndian (Asian)IndonesianInupiatIranianIraqiIrishIroquoisIsraeliItalianJamaicanJapaneseJordanianKenyanKiowaKoreanLaotianLatvianLebaneseLiberianLithuanianLumbeeLuxembourgerMacedonianMalaysianMalteseMarshalleseMenomineeMexicanMexican American IndianMongolianMoroccanNative HawaiianNavajoNepaleseNew ZealanderNicaraguanNigerianNorthern EuropeanNorwegianOkinawanOsageOttawaPaiutePakistaniPalestinianPanamanianParaguayanPennsylvania GermanPeruvianPimaPolishPortuguesePotawatomiPuebloPuerto RicanPuget Sound SalishRomanianRussianSalvadoranSamoanScandinavianScotch-IrishScottishSeminoleSenegaleseSerbianShoshoneSierra LeoneanSiouxSlavicSlovakSloveneSomaliSouth AfricanSouth AmericanSouth American IndianSoviet UnionSpaniardSpanishSpanish AmericanSpanish American IndianSri LankanSubsaharan AfricanSudaneseSwedishSwissSyrianTaiwaneseThaiTlingit-HaidaTohono O'OdhamTonganTrinidadian and TobagonianTsimshianTurkishU.S. Virgin IslanderUgandanUkrainianUruguayanUteVenezuelanVietnameseWelshWest IndianYakamaYaquiYugoslavianYumanYup'ikZimbabwean
Immigration
NonimmigrantsImmigrantsAfghanistanAfricaAlbaniaArgentinaArmeniaAsiaAustraliaAustriaBahamasBangladeshBarbadosBelarusBelgiumBelizeBoliviaBosnia and HerzegovinaBrazilBulgariaBurma/MyanmarCabo VerdeCambodiaCameroonCanadaCaribbeanCentral AmericaChileChinaColombiaCongoCosta RicaCroatiaCubaCzechoslovakiaDenmarkDominicaDominican RepublicEastern AfricaEastern AsiaEastern EuropeEcuadorEgyptEl SalvadorEnglandEritreaEthiopiaEuropeFijiFranceGermanyGhanaGreeceGrenadaGuatemalaGuyanaHaitiHondurasHong KongHungaryIndiaIndonesiaIranIraqIrelandIsraelItalyJamaicaJapanJordanKazakhstanKenyaKoreaKuwaitLaosLatin AmericaLatviaLebanonLiberiaLithuaniaMalaysiaMexicoMicronesiaMiddle AfricaMoldovaMoroccoNepalNetherlandsNicaraguaNigeriaNorth AmericaNorth MacedoniaNorthern AfricaNorthern EuropeNorwayOceaniaPakistanPanamaPeruPhilippinesPolandPortugalRomaniaRussiaSaudi ArabiaScotlandSenegalSerbiaSierra LeoneSingaporeSomaliaSouth AfricaSouth AmericaSouth Central AsiaSouth Eastern AsiaSouthern EuropeSpainSri LankaSt. Vincent and the GrenadinesSudanSwedenSwitzerlandSyriaTaiwanThailandTrinidad and TobagoTurkeyUgandaUkraineUruguayUzbekistanVenezuelaVietnamWest IndiesWestern AfricaWestern AsiaWestern EuropeYemenZaireZimbabweAzores
Associate's Degree
Income
Poverty
Unemployment
Labor Participation
Family Structure
Vehicle Availability
Education Level
Disability

Associate's Degree Comparison

Egyptians

Immigrants from Western Africa

Exceptional
Tragic
50.9%
ASSOCIATE'S DEGREE
99.5/ 100
METRIC RATING
69th/ 347
METRIC RANK
44.1%
ASSOCIATE'S DEGREE
6.6/ 100
METRIC RATING
221st/ 347
METRIC RANK

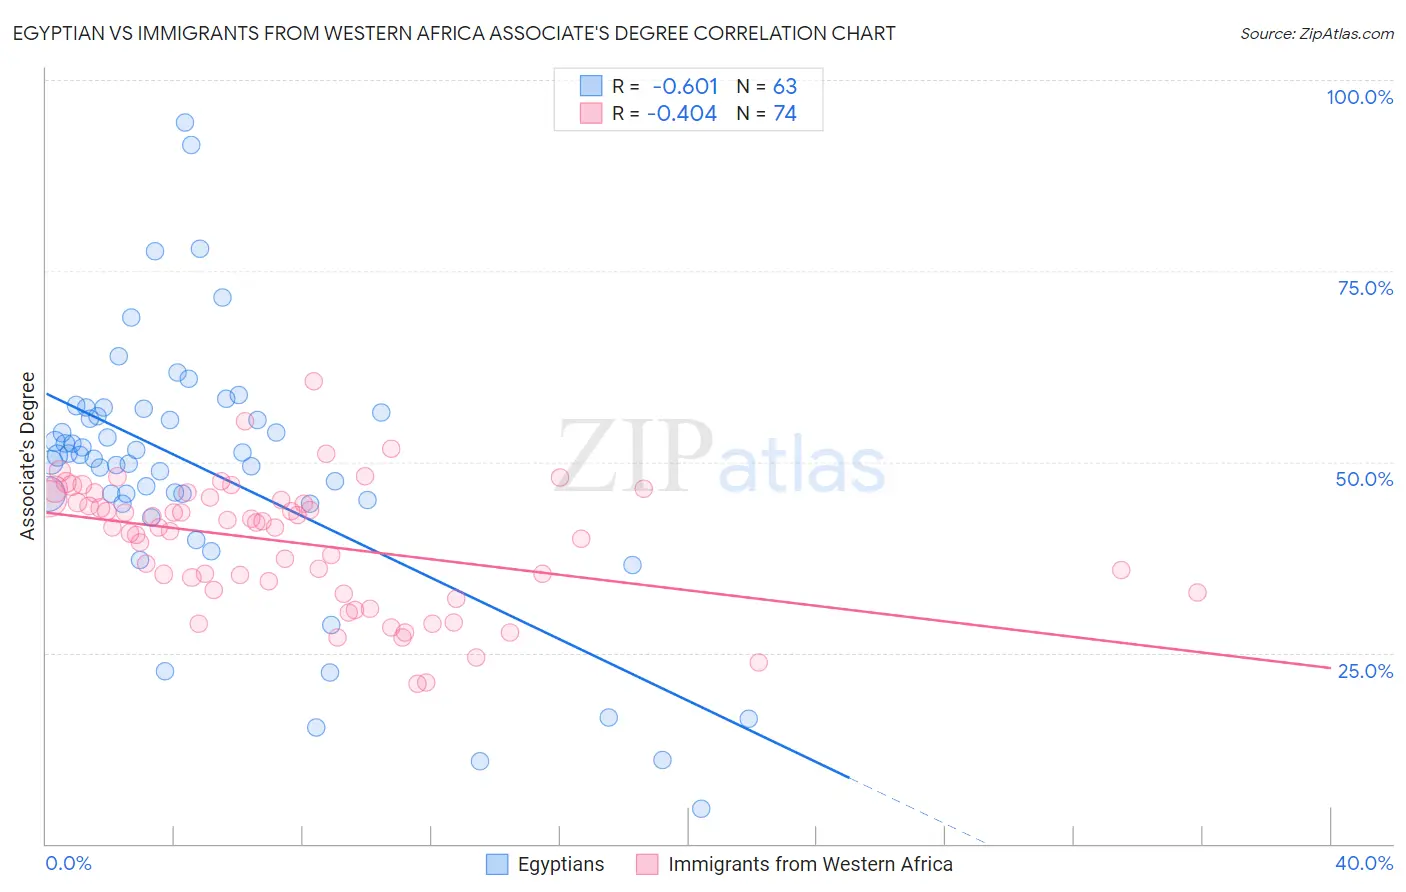
Egyptian vs Immigrants from Western Africa Associate's Degree Correlation Chart

The statistical analysis conducted on geographies consisting of 276,910,507 people shows a significant negative correlation between the proportion of Egyptians and percentage of population with at least associate's degree education in the United States with a correlation coefficient (R) of -0.601 and weighted average of 50.9%. Similarly, the statistical analysis conducted on geographies consisting of 357,851,677 people shows a moderate negative correlation between the proportion of Immigrants from Western Africa and percentage of population with at least associate's degree education in the United States with a correlation coefficient (R) of -0.404 and weighted average of 44.1%, a difference of 15.6%.
Egyptian vs Immigrants from Western Africa Associate's Degree

Associate's Degree Correlation Summary

MeasurementEgyptianImmigrants from Western Africa
Minimum4.6%21.0%
Maximum94.5%60.6%
Range89.9%39.6%
Mean48.7%39.4%
Median50.8%41.4%
Interquartile 25% (IQ1)44.6%33.2%
Interquartile 75% (IQ3)56.5%45.1%
Interquartile Range (IQR)11.9%11.9%
Standard Deviation (Sample)17.2%8.2%
Standard Deviation (Population)17.1%8.1%

Similar Demographics by Associate's Degree

Demographics Similar to Egyptians by Associate's Degree

In terms of associate's degree, the demographic groups most similar to Egyptians are Immigrants from Argentina (50.9%, a difference of 0.030%), Immigrants from Romania (50.9%, a difference of 0.040%), Immigrants from Pakistan (50.9%, a difference of 0.10%), Immigrants from Indonesia (51.0%, a difference of 0.12%), and Carpatho Rusyn (50.6%, a difference of 0.57%).
DemographicsRating | RankAssociate's Degree
Bhutanese
99.7
/100
|
#62
Exceptional
51.4%
South Africans
99.7
/100
|
#63
Exceptional
51.4%
Immigrants | Netherlands
99.7
/100
|
#64
Exceptional
51.4%
Zimbabweans
99.7
/100
|
#65
Exceptional
51.3%
Immigrants | Europe
99.7
/100
|
#66
Exceptional
51.3%
Argentineans
99.6
/100
|
#67
Exceptional
51.2%
Immigrants | Indonesia
99.5
/100
|
#68
Exceptional
51.0%
Egyptians
99.5
/100
|
#69
Exceptional
50.9%
Immigrants | Argentina
99.5
/100
|
#70
Exceptional
50.9%
Immigrants | Romania
99.5
/100
|
#71
Exceptional
50.9%
Immigrants | Pakistan
99.5
/100
|
#72
Exceptional
50.9%
Carpatho Rusyns
99.3
/100
|
#73
Exceptional
50.6%
Lithuanians
99.3
/100
|
#74
Exceptional
50.6%
Immigrants | Scotland
99.3
/100
|
#75
Exceptional
50.6%
Immigrants | Zimbabwe
99.2
/100
|
#76
Exceptional
50.5%

Demographics Similar to Immigrants from Western Africa by Associate's Degree

In terms of associate's degree, the demographic groups most similar to Immigrants from Western Africa are Portuguese (44.1%, a difference of 0.20%), White/Caucasian (44.2%, a difference of 0.27%), Barbadian (43.9%, a difference of 0.27%), Subsaharan African (43.9%, a difference of 0.37%), and West Indian (43.8%, a difference of 0.51%).
DemographicsRating | RankAssociate's Degree
Immigrants | Middle Africa
12.7
/100
|
#214
Poor
44.7%
Immigrants | Panama
12.4
/100
|
#215
Poor
44.7%
Immigrants | Nigeria
11.4
/100
|
#216
Poor
44.6%
Immigrants | Immigrants
10.5
/100
|
#217
Poor
44.5%
Spanish
9.4
/100
|
#218
Tragic
44.4%
Whites/Caucasians
7.5
/100
|
#219
Tragic
44.2%
Portuguese
7.2
/100
|
#220
Tragic
44.1%
Immigrants | Western Africa
6.6
/100
|
#221
Tragic
44.1%
Barbadians
5.8
/100
|
#222
Tragic
43.9%
Sub-Saharan Africans
5.5
/100
|
#223
Tragic
43.9%
West Indians
5.2
/100
|
#224
Tragic
43.8%
Guamanians/Chamorros
4.8
/100
|
#225
Tragic
43.8%
Immigrants | Burma/Myanmar
4.3
/100
|
#226
Tragic
43.7%
Trinidadians and Tobagonians
4.0
/100
|
#227
Tragic
43.6%
Hmong
3.2
/100
|
#228
Tragic
43.4%