Egyptian vs Immigrants from South America Associate's Degree
COMPARE
Egyptian
Immigrants from South America
Associate's Degree
Associate's Degree Comparison
Egyptians
Immigrants from South America
50.9%
ASSOCIATE'S DEGREE
99.5/ 100
METRIC RATING
69th/ 347
METRIC RANK
46.7%
ASSOCIATE'S DEGREE
59.9/ 100
METRIC RATING
165th/ 347
METRIC RANK
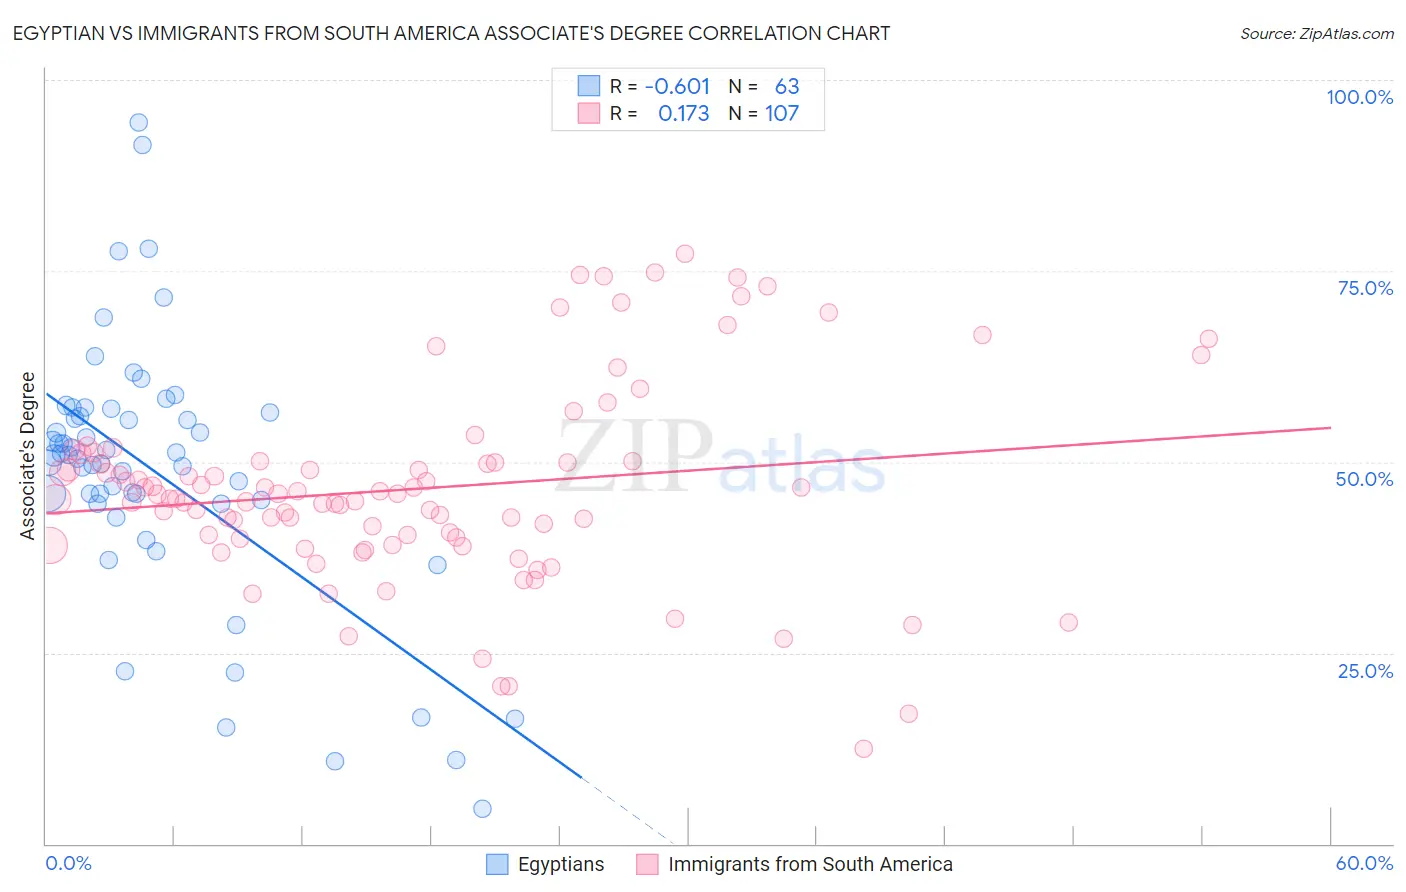
Egyptian vs Immigrants from South America Associate's Degree Correlation Chart
The statistical analysis conducted on geographies consisting of 276,910,507 people shows a significant negative correlation between the proportion of Egyptians and percentage of population with at least associate's degree education in the United States with a correlation coefficient (R) of -0.601 and weighted average of 50.9%. Similarly, the statistical analysis conducted on geographies consisting of 486,384,317 people shows a poor positive correlation between the proportion of Immigrants from South America and percentage of population with at least associate's degree education in the United States with a correlation coefficient (R) of 0.173 and weighted average of 46.7%, a difference of 9.1%.
Associate's Degree Correlation Summary
| Measurement | Egyptian | Immigrants from South America |
| Minimum | 4.6% | 12.4% |
| Maximum | 94.5% | 77.3% |
| Range | 89.9% | 64.9% |
| Mean | 48.7% | 46.5% |
| Median | 50.8% | 45.2% |
| Interquartile 25% (IQ1) | 44.6% | 40.0% |
| Interquartile 75% (IQ3) | 56.5% | 50.0% |
| Interquartile Range (IQR) | 11.9% | 10.0% |
| Standard Deviation (Sample) | 17.2% | 12.9% |
| Standard Deviation (Population) | 17.1% | 12.8% |
Similar Demographics by Associate's Degree
Demographics Similar to Egyptians by Associate's Degree
In terms of associate's degree, the demographic groups most similar to Egyptians are Immigrants from Argentina (50.9%, a difference of 0.030%), Immigrants from Romania (50.9%, a difference of 0.040%), Immigrants from Pakistan (50.9%, a difference of 0.10%), Immigrants from Indonesia (51.0%, a difference of 0.12%), and Carpatho Rusyn (50.6%, a difference of 0.57%).
| Demographics | Rating | Rank | Associate's Degree |
| Bhutanese | 99.7 /100 | #62 | Exceptional 51.4% |
| South Africans | 99.7 /100 | #63 | Exceptional 51.4% |
| Immigrants | Netherlands | 99.7 /100 | #64 | Exceptional 51.4% |
| Zimbabweans | 99.7 /100 | #65 | Exceptional 51.3% |
| Immigrants | Europe | 99.7 /100 | #66 | Exceptional 51.3% |
| Argentineans | 99.6 /100 | #67 | Exceptional 51.2% |
| Immigrants | Indonesia | 99.5 /100 | #68 | Exceptional 51.0% |
| Egyptians | 99.5 /100 | #69 | Exceptional 50.9% |
| Immigrants | Argentina | 99.5 /100 | #70 | Exceptional 50.9% |
| Immigrants | Romania | 99.5 /100 | #71 | Exceptional 50.9% |
| Immigrants | Pakistan | 99.5 /100 | #72 | Exceptional 50.9% |
| Carpatho Rusyns | 99.3 /100 | #73 | Exceptional 50.6% |
| Lithuanians | 99.3 /100 | #74 | Exceptional 50.6% |
| Immigrants | Scotland | 99.3 /100 | #75 | Exceptional 50.6% |
| Immigrants | Zimbabwe | 99.2 /100 | #76 | Exceptional 50.5% |
Demographics Similar to Immigrants from South America by Associate's Degree
In terms of associate's degree, the demographic groups most similar to Immigrants from South America are Hungarian (46.7%, a difference of 0.040%), Immigrants from Sierra Leone (46.7%, a difference of 0.050%), Colombian (46.8%, a difference of 0.20%), Somali (46.8%, a difference of 0.21%), and Immigrants from Africa (46.8%, a difference of 0.26%).
| Demographics | Rating | Rank | Associate's Degree |
| Immigrants | Germany | 69.7 /100 | #158 | Good 47.1% |
| Immigrants | Poland | 69.2 /100 | #159 | Good 47.1% |
| Scottish | 65.4 /100 | #160 | Good 46.9% |
| Scandinavians | 65.2 /100 | #161 | Good 46.9% |
| Immigrants | Africa | 63.2 /100 | #162 | Good 46.8% |
| Somalis | 62.5 /100 | #163 | Good 46.8% |
| Colombians | 62.4 /100 | #164 | Good 46.8% |
| Immigrants | South America | 59.9 /100 | #165 | Average 46.7% |
| Hungarians | 59.3 /100 | #166 | Average 46.7% |
| Immigrants | Sierra Leone | 59.2 /100 | #167 | Average 46.7% |
| Immigrants | Somalia | 55.5 /100 | #168 | Average 46.5% |
| Uruguayans | 55.4 /100 | #169 | Average 46.5% |
| Irish | 53.6 /100 | #170 | Average 46.5% |
| Basques | 52.8 /100 | #171 | Average 46.5% |
| Peruvians | 50.5 /100 | #172 | Average 46.4% |