Dutch West Indian vs Soviet Union Unemployment
COMPARE
Dutch West Indian
Soviet Union
Unemployment
Unemployment Comparison
Dutch West Indians
Soviet Union
5.6%
UNEMPLOYMENT
1.2/ 100
METRIC RATING
244th/ 347
METRIC RANK
5.4%
UNEMPLOYMENT
10.6/ 100
METRIC RATING
220th/ 347
METRIC RANK
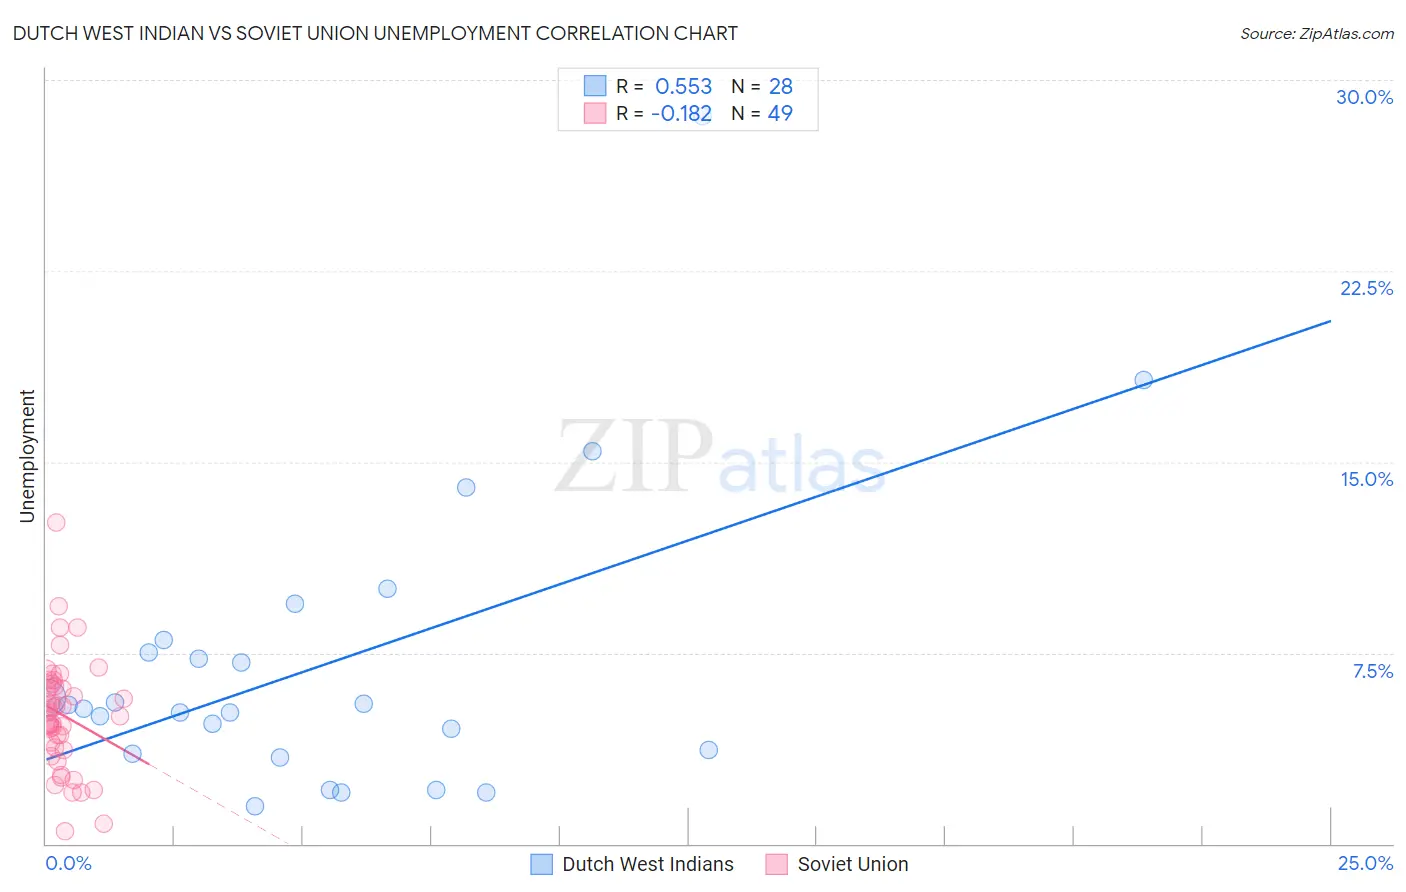
Dutch West Indian vs Soviet Union Unemployment Correlation Chart
The statistical analysis conducted on geographies consisting of 85,705,880 people shows a substantial positive correlation between the proportion of Dutch West Indians and unemployment in the United States with a correlation coefficient (R) of 0.553 and weighted average of 5.6%. Similarly, the statistical analysis conducted on geographies consisting of 43,502,228 people shows a poor negative correlation between the proportion of Soviet Union and unemployment in the United States with a correlation coefficient (R) of -0.182 and weighted average of 5.4%, a difference of 3.4%.
Unemployment Correlation Summary
| Measurement | Dutch West Indian | Soviet Union |
| Minimum | 1.5% | 0.50% |
| Maximum | 28.6% | 12.6% |
| Range | 27.1% | 12.1% |
| Mean | 7.1% | 5.1% |
| Median | 5.4% | 5.2% |
| Interquartile 25% (IQ1) | 3.6% | 3.7% |
| Interquartile 75% (IQ3) | 7.8% | 6.2% |
| Interquartile Range (IQR) | 4.1% | 2.5% |
| Standard Deviation (Sample) | 5.9% | 2.2% |
| Standard Deviation (Population) | 5.7% | 2.2% |
Similar Demographics by Unemployment
Demographics Similar to Dutch West Indians by Unemployment
In terms of unemployment, the demographic groups most similar to Dutch West Indians are French American Indian (5.6%, a difference of 0.020%), Bermudan (5.6%, a difference of 0.070%), Marshallese (5.6%, a difference of 0.15%), Immigrants from Cameroon (5.6%, a difference of 0.21%), and Liberian (5.6%, a difference of 0.34%).
| Demographics | Rating | Rank | Unemployment |
| Moroccans | 3.2 /100 | #237 | Tragic 5.5% |
| Immigrants | Western Asia | 2.8 /100 | #238 | Tragic 5.5% |
| Immigrants | Immigrants | 2.6 /100 | #239 | Tragic 5.5% |
| Cree | 2.6 /100 | #240 | Tragic 5.6% |
| Tlingit-Haida | 2.0 /100 | #241 | Tragic 5.6% |
| Spanish Americans | 2.0 /100 | #242 | Tragic 5.6% |
| Marshallese | 1.3 /100 | #243 | Tragic 5.6% |
| Dutch West Indians | 1.2 /100 | #244 | Tragic 5.6% |
| French American Indians | 1.2 /100 | #245 | Tragic 5.6% |
| Bermudans | 1.1 /100 | #246 | Tragic 5.6% |
| Immigrants | Cameroon | 1.0 /100 | #247 | Tragic 5.6% |
| Liberians | 0.9 /100 | #248 | Tragic 5.6% |
| Cajuns | 0.8 /100 | #249 | Tragic 5.6% |
| Japanese | 0.8 /100 | #250 | Tragic 5.6% |
| Kiowa | 0.6 /100 | #251 | Tragic 5.7% |
Demographics Similar to Soviet Union by Unemployment
In terms of unemployment, the demographic groups most similar to Soviet Union are Immigrants from Philippines (5.4%, a difference of 0.040%), Iroquois (5.4%, a difference of 0.060%), Bangladeshi (5.4%, a difference of 0.080%), Seminole (5.4%, a difference of 0.25%), and Choctaw (5.4%, a difference of 0.30%).
| Demographics | Rating | Rank | Unemployment |
| Immigrants | Middle Africa | 15.3 /100 | #213 | Poor 5.4% |
| Immigrants | Costa Rica | 15.2 /100 | #214 | Poor 5.4% |
| Delaware | 14.7 /100 | #215 | Poor 5.4% |
| Immigrants | South America | 13.5 /100 | #216 | Poor 5.4% |
| Immigrants | Albania | 13.5 /100 | #217 | Poor 5.4% |
| Choctaw | 12.7 /100 | #218 | Poor 5.4% |
| Bangladeshis | 11.2 /100 | #219 | Poor 5.4% |
| Soviet Union | 10.6 /100 | #220 | Poor 5.4% |
| Immigrants | Philippines | 10.4 /100 | #221 | Poor 5.4% |
| Iroquois | 10.3 /100 | #222 | Poor 5.4% |
| Seminole | 9.2 /100 | #223 | Tragic 5.4% |
| Israelis | 8.8 /100 | #224 | Tragic 5.4% |
| South American Indians | 7.8 /100 | #225 | Tragic 5.5% |
| Samoans | 7.1 /100 | #226 | Tragic 5.5% |
| Immigrants | Lebanon | 7.0 /100 | #227 | Tragic 5.5% |