Dutch West Indian vs Soviet Union Unemployment Among Ages 20 to 24 years
COMPARE
Dutch West Indian
Soviet Union
Unemployment Among Ages 20 to 24 years
Unemployment Among Ages 20 to 24 years Comparison
Dutch West Indians
Soviet Union
10.9%
UNEMPLOYMENT AMONG AGES 20 TO 24 YEARS
0.3/ 100
METRIC RATING
258th/ 347
METRIC RANK
11.7%
UNEMPLOYMENT AMONG AGES 20 TO 24 YEARS
0.0/ 100
METRIC RATING
285th/ 347
METRIC RANK
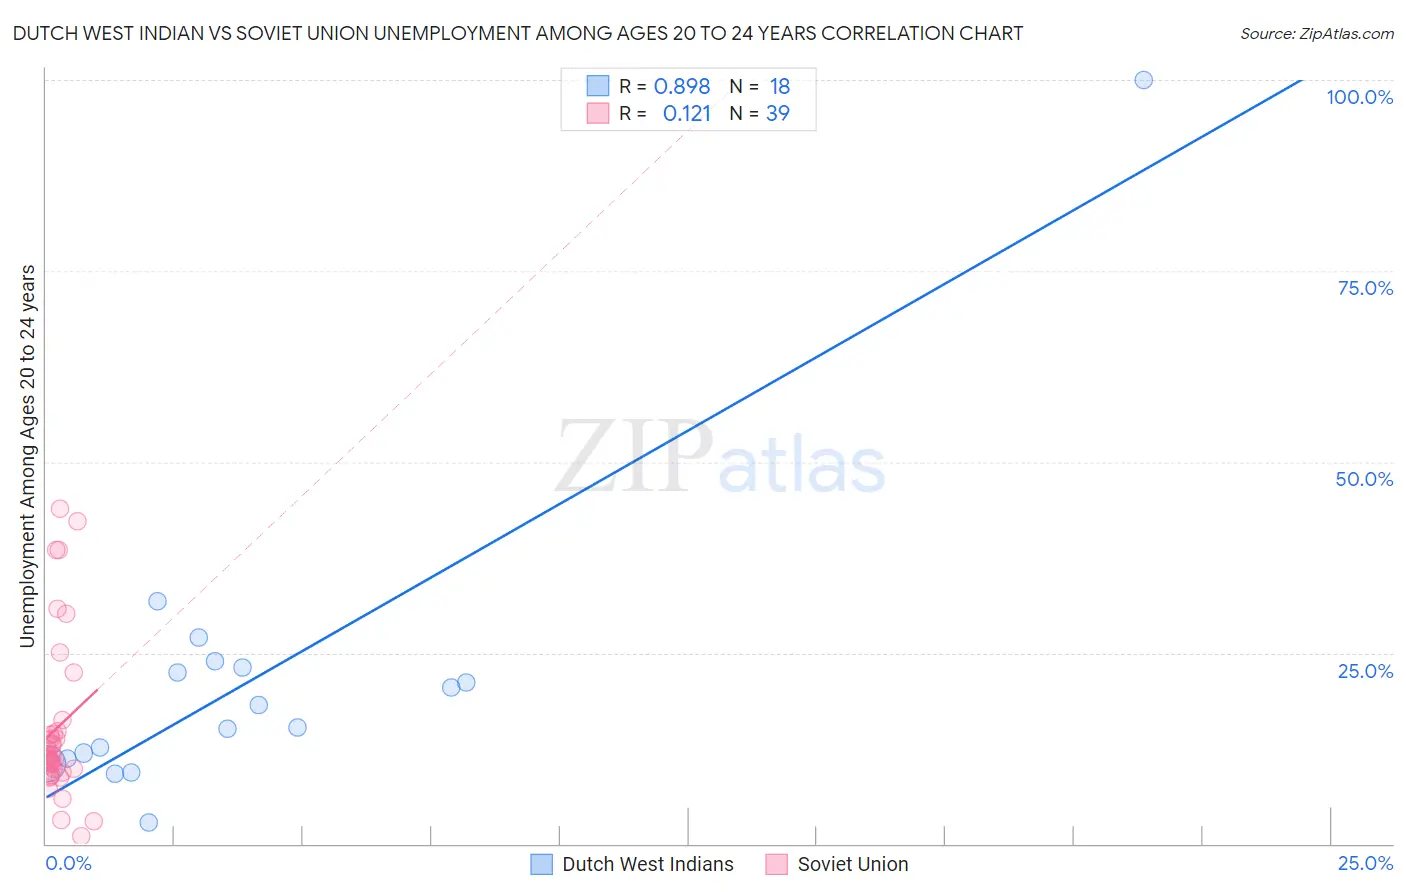
Dutch West Indian vs Soviet Union Unemployment Among Ages 20 to 24 years Correlation Chart
The statistical analysis conducted on geographies consisting of 83,977,939 people shows a very strong positive correlation between the proportion of Dutch West Indians and unemployment rate among population between the ages 20 and 24 in the United States with a correlation coefficient (R) of 0.898 and weighted average of 10.9%. Similarly, the statistical analysis conducted on geographies consisting of 43,419,259 people shows a poor positive correlation between the proportion of Soviet Union and unemployment rate among population between the ages 20 and 24 in the United States with a correlation coefficient (R) of 0.121 and weighted average of 11.7%, a difference of 8.0%.
Unemployment Among Ages 20 to 24 years Correlation Summary
| Measurement | Dutch West Indian | Soviet Union |
| Minimum | 2.8% | 1.0% |
| Maximum | 100.0% | 43.8% |
| Range | 97.2% | 42.8% |
| Mean | 21.4% | 15.2% |
| Median | 16.7% | 11.4% |
| Interquartile 25% (IQ1) | 11.2% | 9.3% |
| Interquartile 75% (IQ3) | 23.1% | 14.7% |
| Interquartile Range (IQR) | 11.9% | 5.4% |
| Standard Deviation (Sample) | 20.9% | 10.7% |
| Standard Deviation (Population) | 20.3% | 10.6% |
Similar Demographics by Unemployment Among Ages 20 to 24 years
Demographics Similar to Dutch West Indians by Unemployment Among Ages 20 to 24 years
In terms of unemployment among ages 20 to 24 years, the demographic groups most similar to Dutch West Indians are Immigrants from Western Asia (10.9%, a difference of 0.070%), Panamanian (10.9%, a difference of 0.10%), Immigrants from Lebanon (10.9%, a difference of 0.13%), Immigrants from Bahamas (10.9%, a difference of 0.14%), and Liberian (10.8%, a difference of 0.24%).
| Demographics | Rating | Rank | Unemployment Among Ages 20 to 24 years |
| Immigrants | Panama | 0.4 /100 | #251 | Tragic 10.8% |
| Immigrants | Syria | 0.4 /100 | #252 | Tragic 10.8% |
| Spanish Americans | 0.4 /100 | #253 | Tragic 10.8% |
| Liberians | 0.3 /100 | #254 | Tragic 10.8% |
| Immigrants | Israel | 0.3 /100 | #255 | Tragic 10.8% |
| Immigrants | Bahamas | 0.3 /100 | #256 | Tragic 10.9% |
| Immigrants | Western Asia | 0.3 /100 | #257 | Tragic 10.9% |
| Dutch West Indians | 0.3 /100 | #258 | Tragic 10.9% |
| Panamanians | 0.2 /100 | #259 | Tragic 10.9% |
| Immigrants | Lebanon | 0.2 /100 | #260 | Tragic 10.9% |
| Puget Sound Salish | 0.2 /100 | #261 | Tragic 10.9% |
| Immigrants | Latin America | 0.1 /100 | #262 | Tragic 11.0% |
| Marshallese | 0.1 /100 | #263 | Tragic 11.0% |
| Sub-Saharan Africans | 0.0 /100 | #264 | Tragic 11.1% |
| Immigrants | Ireland | 0.0 /100 | #265 | Tragic 11.1% |
Demographics Similar to Soviet Union by Unemployment Among Ages 20 to 24 years
In terms of unemployment among ages 20 to 24 years, the demographic groups most similar to Soviet Union are Immigrants from Western Africa (11.7%, a difference of 0.040%), Ghanaian (11.7%, a difference of 0.050%), Ecuadorian (11.8%, a difference of 0.12%), Immigrants from Ecuador (11.8%, a difference of 0.21%), and U.S. Virgin Islander (11.8%, a difference of 0.27%).
| Demographics | Rating | Rank | Unemployment Among Ages 20 to 24 years |
| Colville | 0.0 /100 | #278 | Tragic 11.6% |
| Bahamians | 0.0 /100 | #279 | Tragic 11.6% |
| Alaskan Athabascans | 0.0 /100 | #280 | Tragic 11.6% |
| Armenians | 0.0 /100 | #281 | Tragic 11.7% |
| Immigrants | Cameroon | 0.0 /100 | #282 | Tragic 11.7% |
| Ghanaians | 0.0 /100 | #283 | Tragic 11.7% |
| Immigrants | Western Africa | 0.0 /100 | #284 | Tragic 11.7% |
| Soviet Union | 0.0 /100 | #285 | Tragic 11.7% |
| Ecuadorians | 0.0 /100 | #286 | Tragic 11.8% |
| Immigrants | Ecuador | 0.0 /100 | #287 | Tragic 11.8% |
| U.S. Virgin Islanders | 0.0 /100 | #288 | Tragic 11.8% |
| Belizeans | 0.0 /100 | #289 | Tragic 11.8% |
| Immigrants | Caribbean | 0.0 /100 | #290 | Tragic 11.8% |
| Central American Indians | 0.0 /100 | #291 | Tragic 11.9% |
| Immigrants | Senegal | 0.0 /100 | #292 | Tragic 11.9% |