Dutch West Indian vs Immigrants from Nicaragua GED/Equivalency
COMPARE
Dutch West Indian
Immigrants from Nicaragua
GED/Equivalency
GED/Equivalency Comparison
Dutch West Indians
Immigrants from Nicaragua
81.6%
GED/EQUIVALENCY
0.0/ 100
METRIC RATING
301st/ 347
METRIC RANK
79.9%
GED/EQUIVALENCY
0.0/ 100
METRIC RATING
323rd/ 347
METRIC RANK
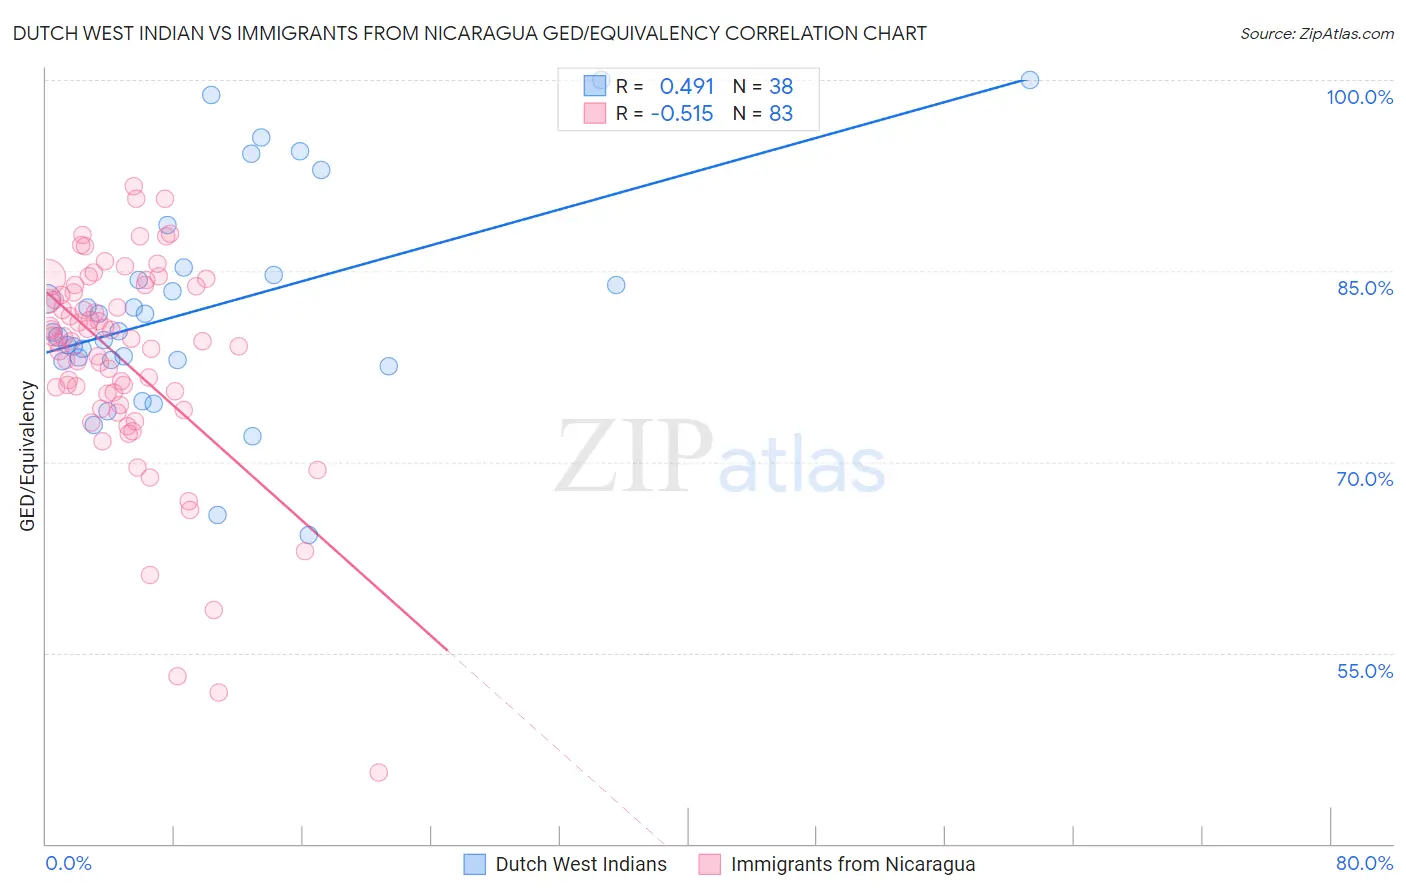
Dutch West Indian vs Immigrants from Nicaragua GED/Equivalency Correlation Chart
The statistical analysis conducted on geographies consisting of 85,776,098 people shows a moderate positive correlation between the proportion of Dutch West Indians and percentage of population with at least ged/equivalency education in the United States with a correlation coefficient (R) of 0.491 and weighted average of 81.6%. Similarly, the statistical analysis conducted on geographies consisting of 236,340,156 people shows a substantial negative correlation between the proportion of Immigrants from Nicaragua and percentage of population with at least ged/equivalency education in the United States with a correlation coefficient (R) of -0.515 and weighted average of 79.9%, a difference of 2.1%.
GED/Equivalency Correlation Summary
| Measurement | Dutch West Indian | Immigrants from Nicaragua |
| Minimum | 64.3% | 45.6% |
| Maximum | 100.0% | 91.7% |
| Range | 35.7% | 46.1% |
| Mean | 82.1% | 77.9% |
| Median | 80.2% | 79.5% |
| Interquartile 25% (IQ1) | 78.0% | 74.4% |
| Interquartile 75% (IQ3) | 84.6% | 83.8% |
| Interquartile Range (IQR) | 6.7% | 9.3% |
| Standard Deviation (Sample) | 8.5% | 8.4% |
| Standard Deviation (Population) | 8.4% | 8.4% |
Similar Demographics by GED/Equivalency
Demographics Similar to Dutch West Indians by GED/Equivalency
In terms of ged/equivalency, the demographic groups most similar to Dutch West Indians are Immigrants from Haiti (81.6%, a difference of 0.040%), Immigrants from Portugal (81.6%, a difference of 0.040%), Fijian (81.6%, a difference of 0.060%), Ecuadorian (81.7%, a difference of 0.13%), and Navajo (81.5%, a difference of 0.14%).
| Demographics | Rating | Rank | GED/Equivalency |
| Immigrants | St. Vincent and the Grenadines | 0.0 /100 | #294 | Tragic 82.0% |
| Nepalese | 0.0 /100 | #295 | Tragic 81.9% |
| Vietnamese | 0.0 /100 | #296 | Tragic 81.9% |
| Immigrants | Bangladesh | 0.0 /100 | #297 | Tragic 81.9% |
| Ute | 0.0 /100 | #298 | Tragic 81.8% |
| Ecuadorians | 0.0 /100 | #299 | Tragic 81.7% |
| Fijians | 0.0 /100 | #300 | Tragic 81.6% |
| Dutch West Indians | 0.0 /100 | #301 | Tragic 81.6% |
| Immigrants | Haiti | 0.0 /100 | #302 | Tragic 81.6% |
| Immigrants | Portugal | 0.0 /100 | #303 | Tragic 81.6% |
| Navajo | 0.0 /100 | #304 | Tragic 81.5% |
| Immigrants | Grenada | 0.0 /100 | #305 | Tragic 81.3% |
| Guyanese | 0.0 /100 | #306 | Tragic 81.3% |
| Immigrants | Dominica | 0.0 /100 | #307 | Tragic 81.1% |
| Puerto Ricans | 0.0 /100 | #308 | Tragic 81.1% |
Demographics Similar to Immigrants from Nicaragua by GED/Equivalency
In terms of ged/equivalency, the demographic groups most similar to Immigrants from Nicaragua are Lumbee (80.0%, a difference of 0.12%), Yup'ik (80.0%, a difference of 0.19%), Immigrants from Cuba (80.2%, a difference of 0.36%), Mexican American Indian (79.4%, a difference of 0.65%), and Honduran (79.3%, a difference of 0.76%).
| Demographics | Rating | Rank | GED/Equivalency |
| Central American Indians | 0.0 /100 | #316 | Tragic 80.6% |
| Immigrants | Caribbean | 0.0 /100 | #317 | Tragic 80.5% |
| Yaqui | 0.0 /100 | #318 | Tragic 80.5% |
| Immigrants | Belize | 0.0 /100 | #319 | Tragic 80.5% |
| Immigrants | Cuba | 0.0 /100 | #320 | Tragic 80.2% |
| Yup'ik | 0.0 /100 | #321 | Tragic 80.0% |
| Lumbee | 0.0 /100 | #322 | Tragic 80.0% |
| Immigrants | Nicaragua | 0.0 /100 | #323 | Tragic 79.9% |
| Mexican American Indians | 0.0 /100 | #324 | Tragic 79.4% |
| Hondurans | 0.0 /100 | #325 | Tragic 79.3% |
| Yuman | 0.0 /100 | #326 | Tragic 79.2% |
| Central Americans | 0.0 /100 | #327 | Tragic 79.2% |
| Hispanics or Latinos | 0.0 /100 | #328 | Tragic 79.1% |
| Dominicans | 0.0 /100 | #329 | Tragic 79.1% |
| Immigrants | Cabo Verde | 0.0 /100 | #330 | Tragic 78.9% |