Dutch West Indian vs Korean GED/Equivalency
COMPARE
Dutch West Indian
Korean
GED/Equivalency
GED/Equivalency Comparison
Dutch West Indians
Koreans
81.6%
GED/EQUIVALENCY
0.0/ 100
METRIC RATING
301st/ 347
METRIC RANK
85.6%
GED/EQUIVALENCY
41.2/ 100
METRIC RATING
178th/ 347
METRIC RANK
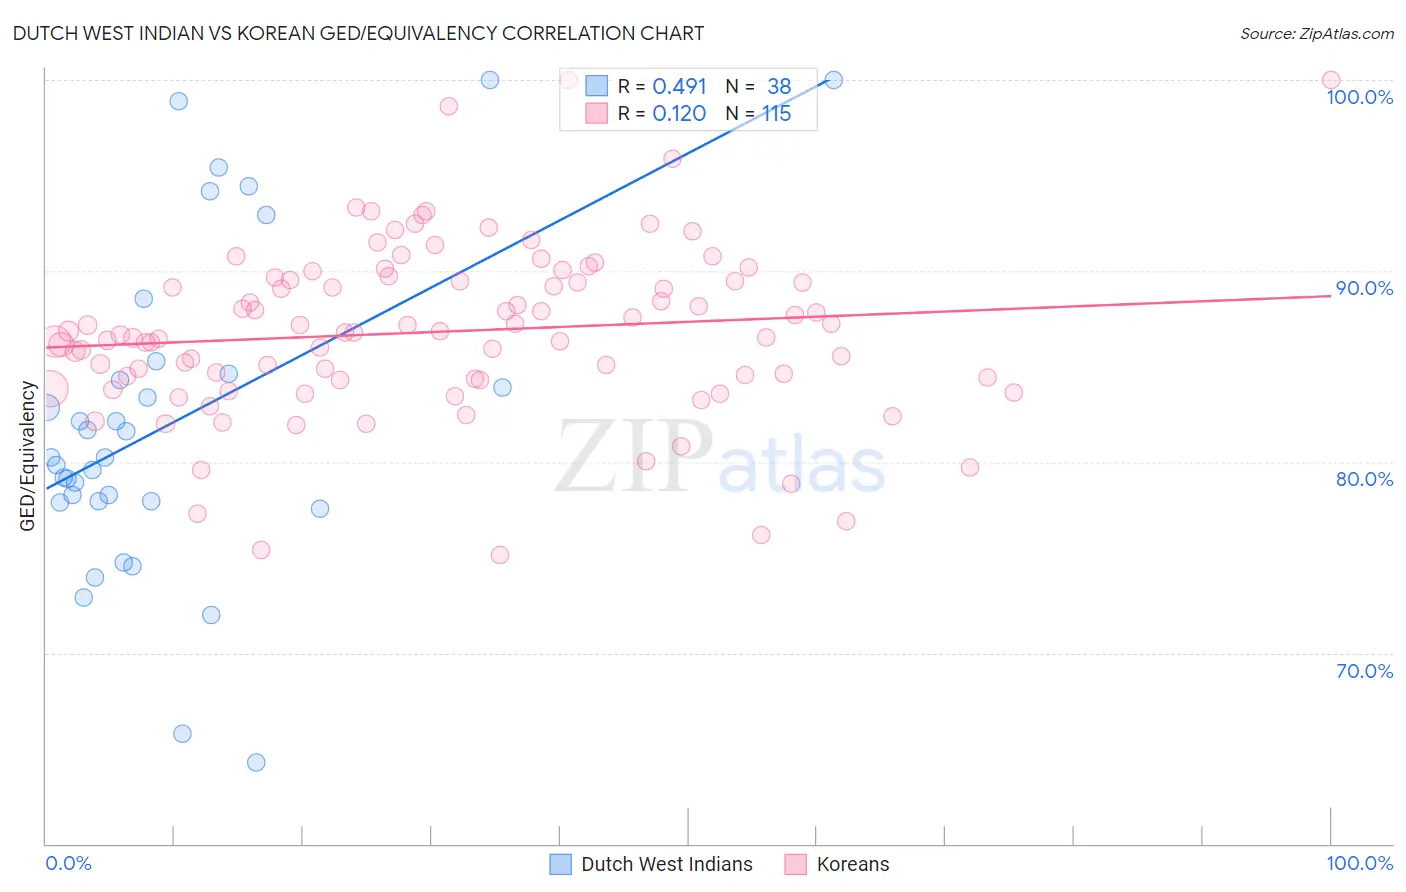
Dutch West Indian vs Korean GED/Equivalency Correlation Chart
The statistical analysis conducted on geographies consisting of 85,776,098 people shows a moderate positive correlation between the proportion of Dutch West Indians and percentage of population with at least ged/equivalency education in the United States with a correlation coefficient (R) of 0.491 and weighted average of 81.6%. Similarly, the statistical analysis conducted on geographies consisting of 510,944,156 people shows a poor positive correlation between the proportion of Koreans and percentage of population with at least ged/equivalency education in the United States with a correlation coefficient (R) of 0.120 and weighted average of 85.6%, a difference of 4.9%.
GED/Equivalency Correlation Summary
| Measurement | Dutch West Indian | Korean |
| Minimum | 64.3% | 75.1% |
| Maximum | 100.0% | 100.0% |
| Range | 35.7% | 24.9% |
| Mean | 82.1% | 86.8% |
| Median | 80.2% | 86.8% |
| Interquartile 25% (IQ1) | 78.0% | 84.3% |
| Interquartile 75% (IQ3) | 84.6% | 89.5% |
| Interquartile Range (IQR) | 6.7% | 5.2% |
| Standard Deviation (Sample) | 8.5% | 4.5% |
| Standard Deviation (Population) | 8.4% | 4.5% |
Similar Demographics by GED/Equivalency
Demographics Similar to Dutch West Indians by GED/Equivalency
In terms of ged/equivalency, the demographic groups most similar to Dutch West Indians are Immigrants from Haiti (81.6%, a difference of 0.040%), Immigrants from Portugal (81.6%, a difference of 0.040%), Fijian (81.6%, a difference of 0.060%), Ecuadorian (81.7%, a difference of 0.13%), and Navajo (81.5%, a difference of 0.14%).
| Demographics | Rating | Rank | GED/Equivalency |
| Immigrants | St. Vincent and the Grenadines | 0.0 /100 | #294 | Tragic 82.0% |
| Nepalese | 0.0 /100 | #295 | Tragic 81.9% |
| Vietnamese | 0.0 /100 | #296 | Tragic 81.9% |
| Immigrants | Bangladesh | 0.0 /100 | #297 | Tragic 81.9% |
| Ute | 0.0 /100 | #298 | Tragic 81.8% |
| Ecuadorians | 0.0 /100 | #299 | Tragic 81.7% |
| Fijians | 0.0 /100 | #300 | Tragic 81.6% |
| Dutch West Indians | 0.0 /100 | #301 | Tragic 81.6% |
| Immigrants | Haiti | 0.0 /100 | #302 | Tragic 81.6% |
| Immigrants | Portugal | 0.0 /100 | #303 | Tragic 81.6% |
| Navajo | 0.0 /100 | #304 | Tragic 81.5% |
| Immigrants | Grenada | 0.0 /100 | #305 | Tragic 81.3% |
| Guyanese | 0.0 /100 | #306 | Tragic 81.3% |
| Immigrants | Dominica | 0.0 /100 | #307 | Tragic 81.1% |
| Puerto Ricans | 0.0 /100 | #308 | Tragic 81.1% |
Demographics Similar to Koreans by GED/Equivalency
In terms of ged/equivalency, the demographic groups most similar to Koreans are Aleut (85.6%, a difference of 0.020%), Immigrants from Southern Europe (85.5%, a difference of 0.060%), Immigrants from Uganda (85.7%, a difference of 0.080%), Moroccan (85.5%, a difference of 0.080%), and Immigrants from Eastern Africa (85.7%, a difference of 0.13%).
| Demographics | Rating | Rank | GED/Equivalency |
| Immigrants | Chile | 57.3 /100 | #171 | Average 85.9% |
| Bermudans | 55.1 /100 | #172 | Average 85.8% |
| Immigrants | Venezuela | 50.7 /100 | #173 | Average 85.8% |
| Ottawa | 50.0 /100 | #174 | Average 85.8% |
| Immigrants | Bolivia | 49.8 /100 | #175 | Average 85.8% |
| Immigrants | Eastern Africa | 47.7 /100 | #176 | Average 85.7% |
| Immigrants | Uganda | 45.2 /100 | #177 | Average 85.7% |
| Koreans | 41.2 /100 | #178 | Average 85.6% |
| Aleuts | 40.5 /100 | #179 | Average 85.6% |
| Immigrants | Southern Europe | 38.4 /100 | #180 | Fair 85.5% |
| Moroccans | 37.7 /100 | #181 | Fair 85.5% |
| Sudanese | 35.2 /100 | #182 | Fair 85.5% |
| Immigrants | Sudan | 34.2 /100 | #183 | Fair 85.5% |
| Immigrants | Oceania | 33.6 /100 | #184 | Fair 85.5% |
| Spanish | 32.8 /100 | #185 | Fair 85.4% |